What's New in 1.5
-
Axe Reports gets a New Look and Feel
Based on your feedback and our usability research, we improved the look and feel of axe® Reports. You can now see better looking graphs with better legibility, navigation, contrast, added splash of color, and information density. That means less time scrolling and searching, and more time focused on what matters most.
-
New Usage Reports for axe DevTools® for Web
A new usage metrics section is available only when you select the product as axe DevTools®, and have configured axe DevTools® for Web for usage tracking.
As an axe® Reports administrator, you can use the usage metrics section alongside other indicators to understand usage such as the count of users and count of screens. Usage metrics in axe® Reports displays the following usage data from axe DevTools® for Web:
-
Usage by month: count of users using various axe DevTools® for Web components (Chrome extension, APIs etc)
-
Top Scanned URLs: count of screens (URLs) by number of times it was scanned in the chosen period
-
-
-
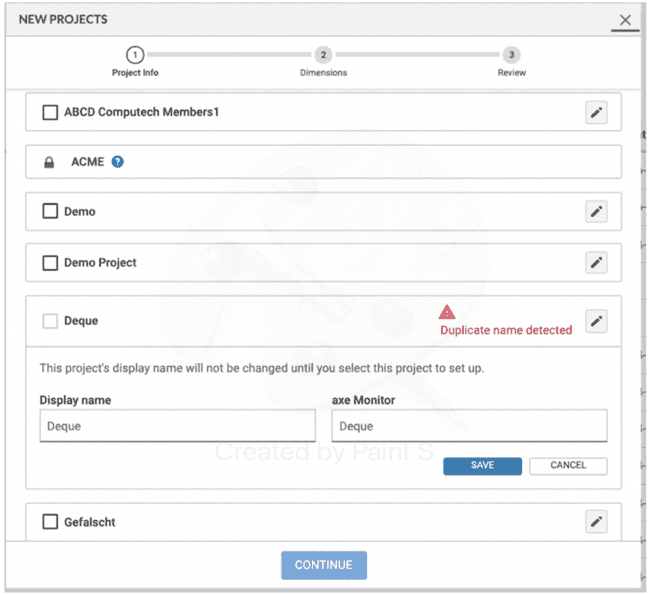
Edit Project Name in the Create New Project Model
The application now warns you in case of any duplicate project names in your organization.
Bug Fixes
-
When the user added two scripts with the same name (Key) using the “Add New Script” page, axe® Reports displayed only one JSON file instead of two files in the “Upload Files” page.
-
When there is only one scan data in axe® Reports, the Key Performance Indicators (KPI) section displayed a "NaN% change" in the percentage change value. The KPI section now displays the appropriate percentage change message.
-
On deleting an existing script, and then adding a new script using the “Add New Script” page displayed an incorrect toast message.
-
The user at times faced an error where the application failed due to the unavailability of the database. This occurred when the server was not automatically reconnecting with the database at times, and is now fixed.
-
Trying to filter projects and scripts based on dimensions on the Manage Projects/Scripts view was not functioning properly.
-
Trying to filter scripts based on dimensions at times was resetting the dimension values in the filtered list to empty.
-
Trying to filter projects or scripts based on dimensions when multiple projects or scripts had the same String was not functioning properly.
Known Issues
-
In some situations, when the difference in score is very low (less than 0.1%), the KPI card for Accessibility Score shows the actual change in score but the previous and current score may be the same because they are rounded to a single decimal place.
-
On the Issues by Category chart, if the number of rows is large (greater than 15), sometimes the x-axis labels get hidden. They become visible if the screen is resized.
-
For a new instance, when there is no data in the system, an incorrect message is displayed.
-
Some special characters, like # and ‘ cause issues during the CSV exports even when it is exported in the utf8 format, causing the CSV file to break. These characters are currently removed when found during the CSV export process.
Browser/Driver Support
- Axe Reports has been tested and is supported on latest versions of Chrome, Firefox, Safari and Edge.


