
Scan Overview
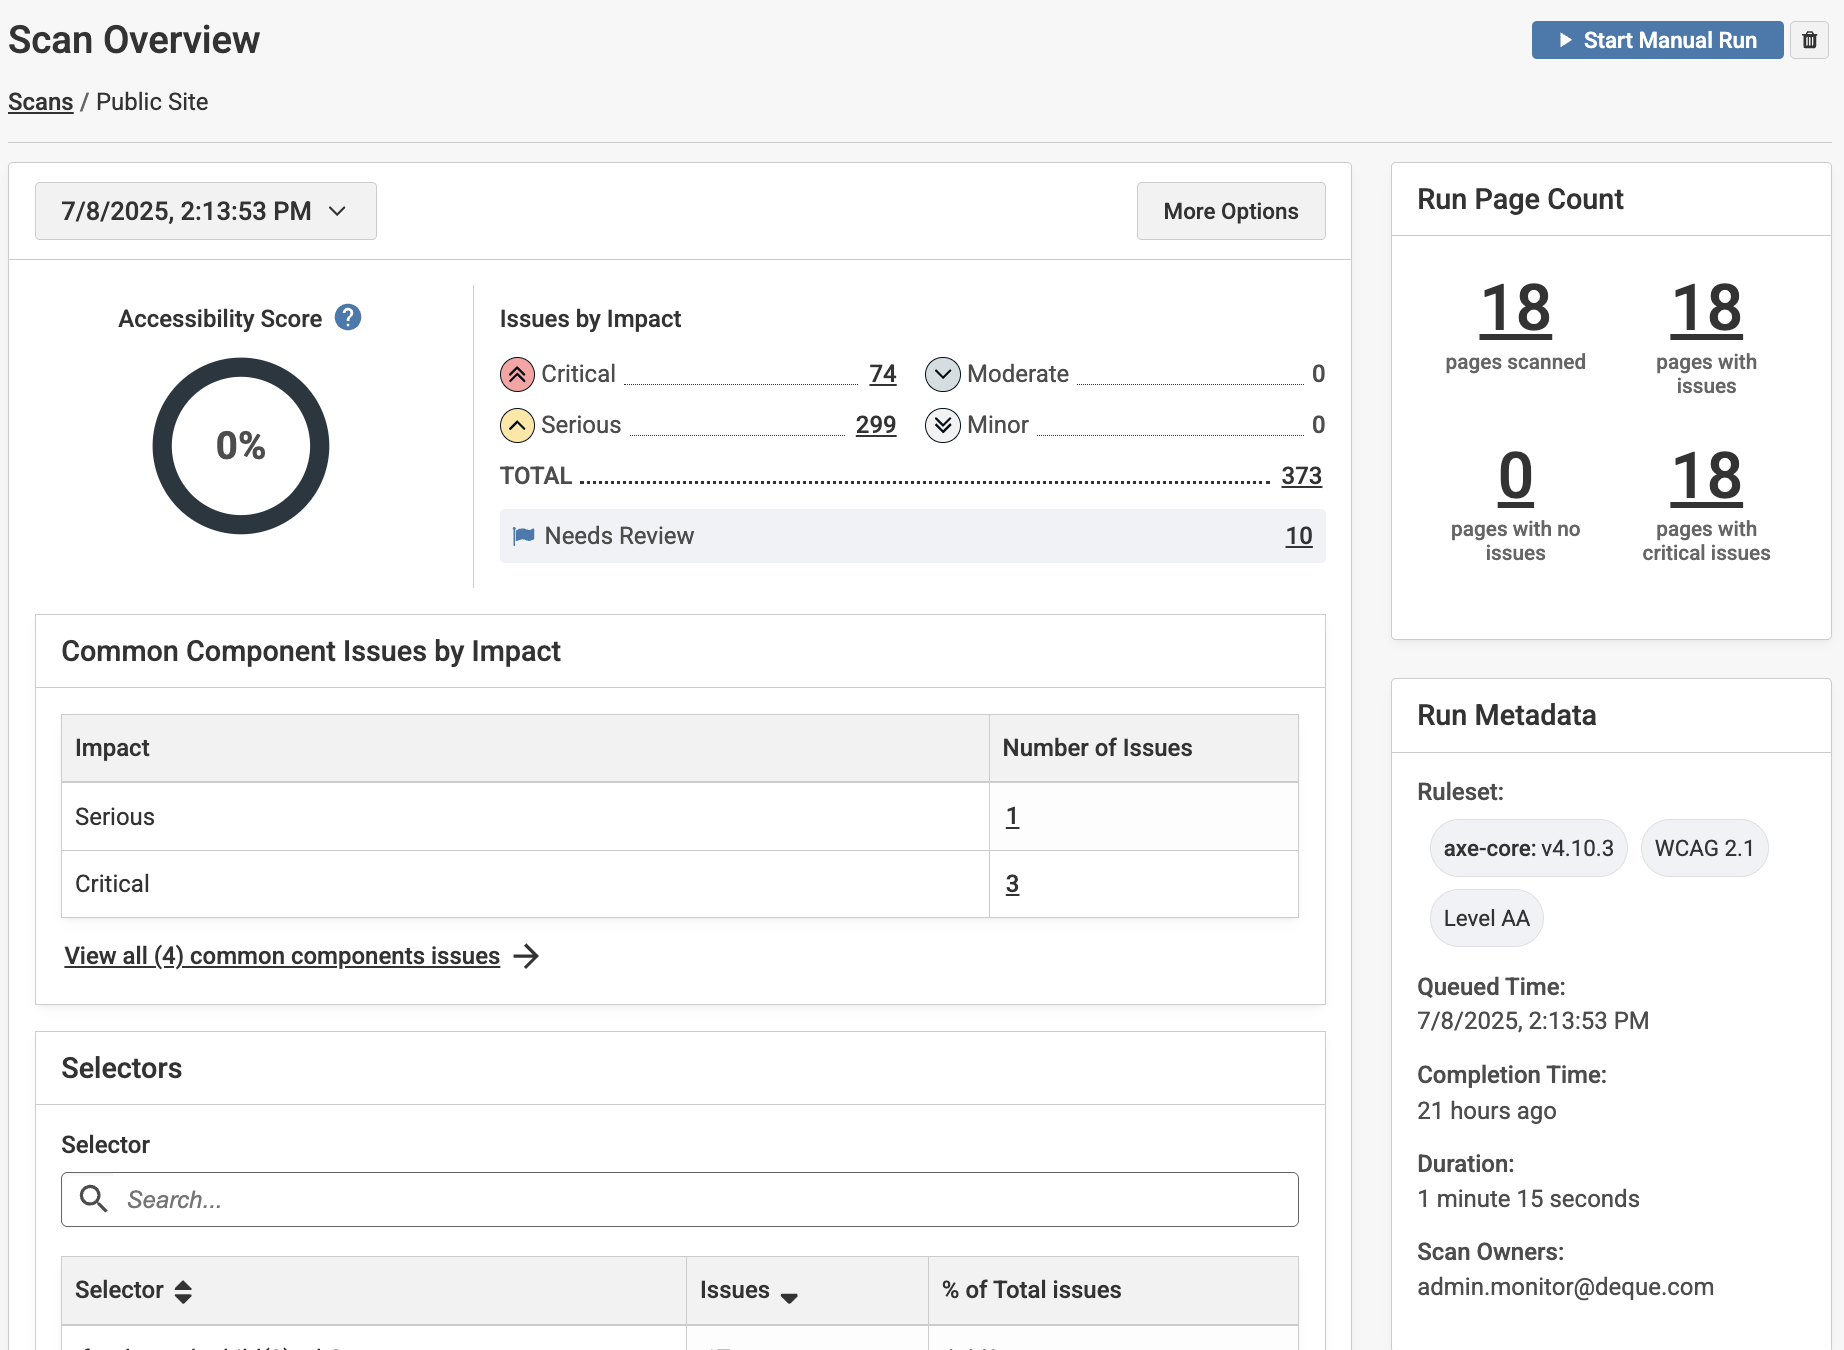
Scan Overview gives users a comprehensive view of a scan’s data on a single page, providing insights for efficiently managing accessibility testing, data visualization, and issue analysis.
To view the Scan Overview page, select the Scans link in the main navigation menu, and select a scan name.
The Scan Overview page allows you to track progress over time across scan runs. Throughout the Scan Overview page, issue and page counts link directly to relevant filters, so you can focus on fixing the most important issues in your scan results.
Scan run history
The date and time dropdown contains previous scan runs.The three most recent successful scan runs show with the date and time the run completed, status, total issues, and critical issues.
To retain older scan history for reporting purposes, send your scan data to axe Reports.
More Options
The “More Options” button allows you to:
- Edit the scan settings (admins only)
- Upload issues from another axe tool
- Show or hide “Needs Review” issues
If enabled in the scan settings, you may also:
- Update axe Reports with the latest scan data
- Share a public link that gives limited access to the scan’s results
Accessibility Score
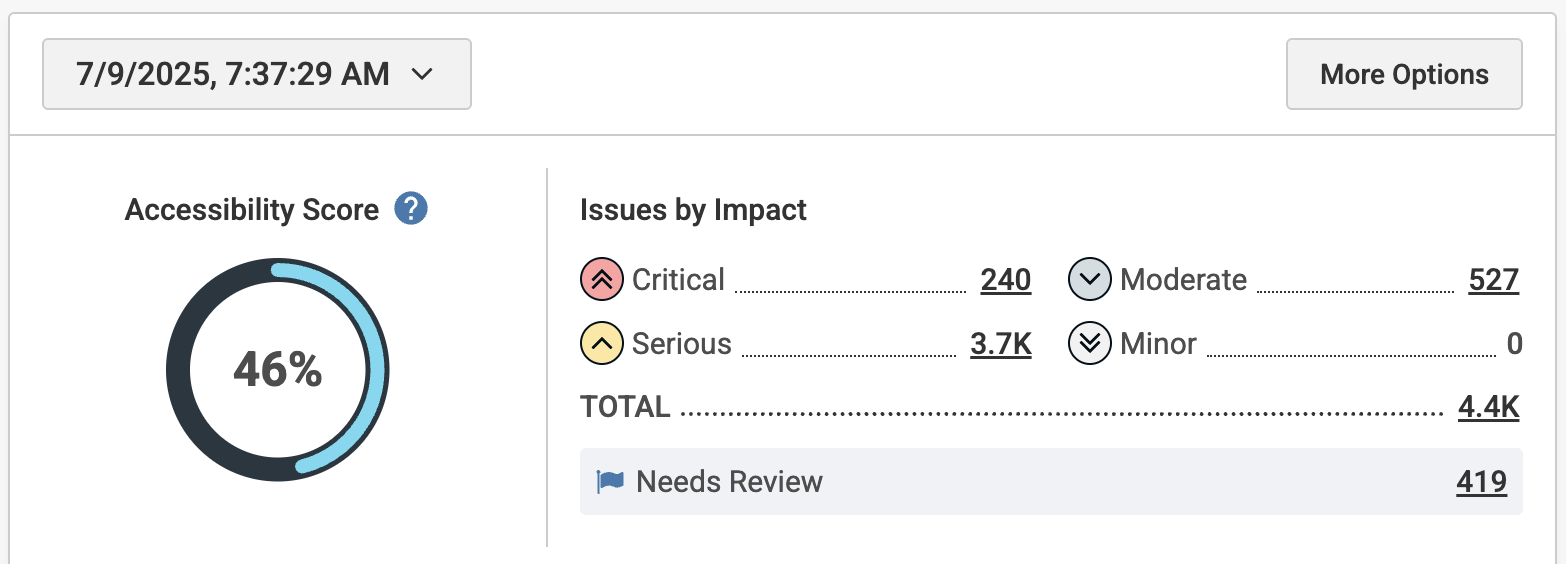
The Accessibility Score is displayed as a percentage and is calculated based on factors such as the total number of pages, the number of issues, and the severity of those issues. Accessibility Score is an average score for each page in the project, with scores assigned as follows: 0% for critical issues, 40% for serious issues, 80% for moderate issues, and 100% for good accessibility.
Understanding How Accessibility Score is Calculated
-
Issues are categorized as Critical, Serious, Moderate or Minor.
-
Pages are categorized as Critical, Serious, Fair, or Good based on the most impactful issue on the page. That is, if a page has one Critical issue, the page is Critical; one Serious issue, the page is Serious; one Moderate issue, the page is Fair; and if a page only contains Minor issues, it is Good.
-
The Accessibility Score is based on the page categories and is calculated according to the following formula:
- (0.4p2 + 0.8p1 + p0)/ TP where:
p2 = number of Serious pages
p1 = number of Fair pages
p0 = number of Good pages
TP=Total pages
- (0.4p2 + 0.8p1 + p0)/ TP where:
For example, axe Monitor gives 40% for a page that has Serious issues, 80% for a page that has Moderate issues, 100% for pages with only Minor issues, and 0% for pages having Critical issues. Axe Monitor automatically assigns 0% when a critical issue exists.
Issues By Impact
Issue counts are broken down by Critical, Serious, Moderate, Minor, and Total. Select the issue counts to drill into details for filtered results.
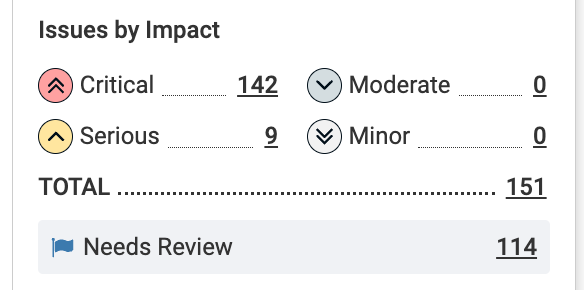
Needs Review
The total number of results marked as Needs Review can be selected. A result marked as Needs Review must be verified by a person to conclude whether or not it is an actual issue. Selecting the count directs you to the Issues page with the applied filters.
Note: To learn more about Issues and Needs Review, read the topic, Issues vs. Needs Review.
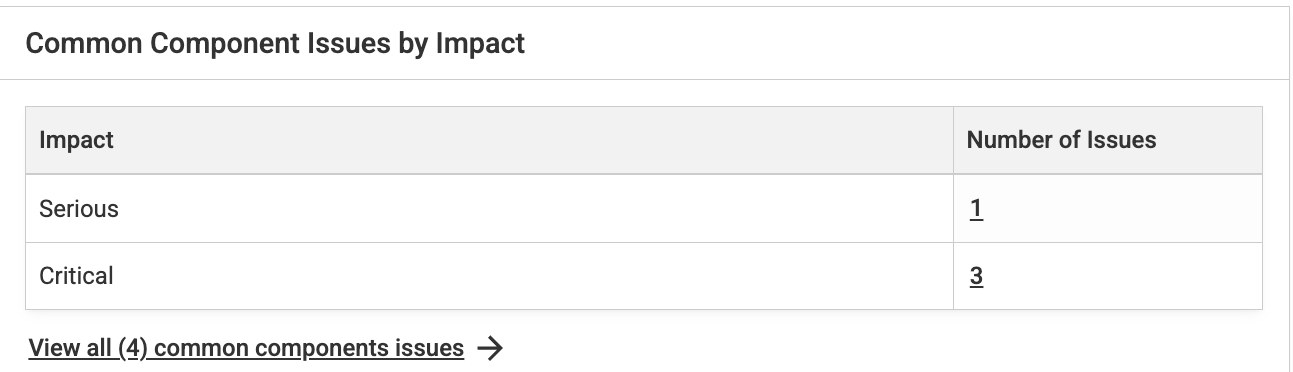
Prioritize by Common Components
If the scan settings have Common Components applied and accessibility issues are found, the “Common Component Issues by Impact” table allows you to understand which common component fixes should be prioritized first. Select a count in the table for a filtered list of critical, serious, moderate, or minor issues related to common components.
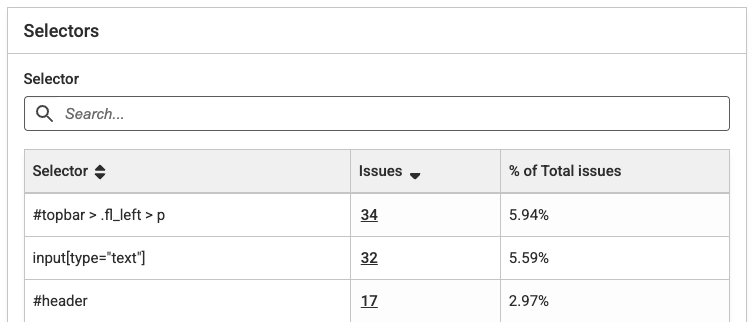
Prioritize by Selectors
Selectors are used in your site’s codebase to structure and format the website. Selectors often appear across several pages. Fixing an accessibility issue on one selector, or in one area of your code, is often more impactful to reducing your overall issues. For example, fixing an accessibility issue on an “img” selector may fix 20% of all the accessibility issues in your results.
Search for a selector by partial or exact match to narrow your results in the table.
The table shows the selector, number of issues and a link to a filtered issue list, and the % of total issues from this selector. The most important selectors to fix first show at the top of the table. By default, the table is sorted by selectors responsible for the highest % of accessibility issues.
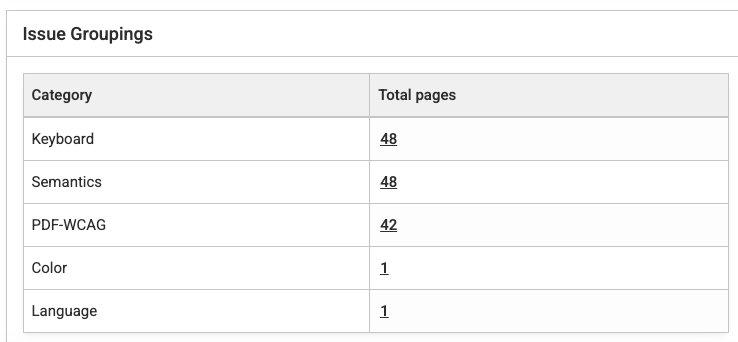
Issues Groupings
This panel displays the Issues by Issue Group. These groupings, defined by axe-core, allow you to understand common themes in your scan results. For example, if you have a high number of accessibility issues on ARIA elements or Text Alternatives, you may want to identify training opportunities for your team to prevent these issues in the future.
Select the page count to learn more about the results causing each issue group trend.
Page drill-down (Run Page Count)
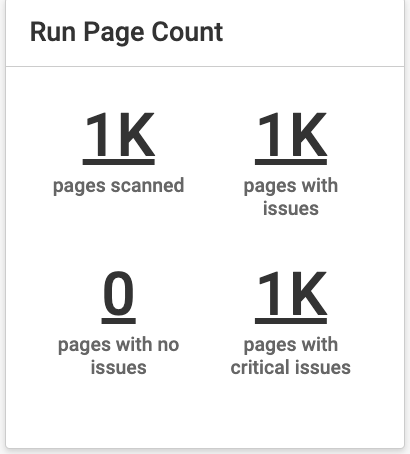
This section displays the count of scanned pages, pages with issues, pages with no issues, and pages with critical issues. Selecting a count allows you to drill into a list of the pages with the applied filters.
Run Metadata
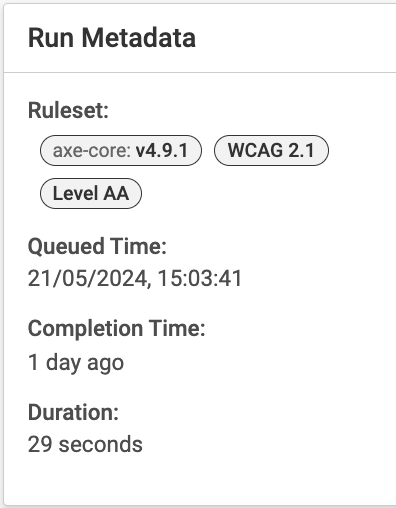
This section displays the details of the last run scan. The information contains the ruleset, queued time, completion date and time, and the duration of the scan run.