What's New in 1.8
-
Knowledge Base
We have curated a comprehensive Knowledge Base featuring articles on common scenarios and best practices for our products. Access the Knowledge Base using your existing login credentials that you use to login to the products.
-
Help Icon on the Main Toolbar
The Help Icon has been relocated from the Welcome dropdown menu to the main toolbar for easy access. The new Need Help icon is now more user friendly, easily visible and can be used to quickly navigate to the relevant support topics.
-
Usage by Month Chart Based on Departments
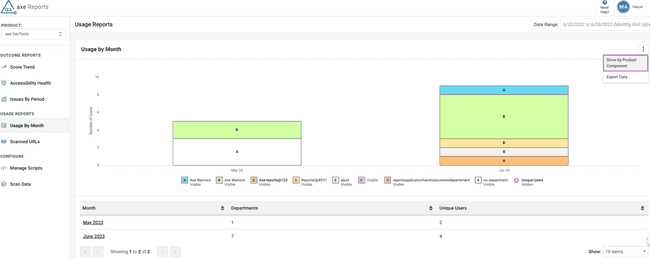
Axe Reports has introduced the Usage by Month chart based on departments. You can use this to analyze user activity with Deque products across different departments. This chart provides valuable insights into the number of users utilizing the products and the specific departments they belong to.
To access department-based reporting, click on the vertical ellipsis icon and choose the Show by Department toggle option. This chart will help you gain a more detailed understanding of product usage within your organization, empowering you to make informed decisions and optimize resources based on departments more efficiently.
-
Column Name Update
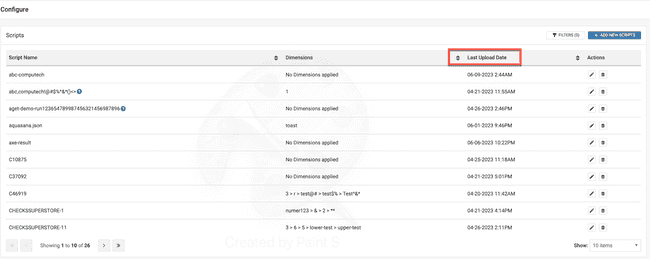
Axe Reports has made an update to the column name Data Updated in both the Manage Projects and Manage Scripts screens. The columns are now called Last Upload Date. This name change makes it clear to the user that the information in the column is regarding the last date and time when the project and script data were uploaded.
Bug Fixes
-
Multiple A11y bugs fixed to help ensure a more inclusive and accessible user experience.
-
Uploading two scans with the same alphanumeric names (the names included different special characters in their names) displayed an error message even after successfully uploading the script and displaying it in the Scripts table.
-
A few screens such as the Add New Project screen had content overlap or a horizontal scroll bar would appear when the size of the screen was zoomed to 200%.
-
Sorting of columns in the Configure Scripts screen was not working.
-
On the Issues by Category chart, if the number of rows is large (greater than 15), sometimes the x-axis labels was getting hidden. They became visible if the screen was resized.
-
Hovering over the Edit link of the project on the Configure page, and while editing the project displayed the project name incorrectly.
Known Issues
-
Some special characters, like # and ‘ cause issues during the CSV exports even when it is exported in the utf8 format, causing the CSV file to break. These characters are currently removed when found during the CSV export process.
-
When an organization administrator deletes a scan or a project/script after applying some filters, the screen refreshes and shows the filter still applied with the table showing all data (irrespective of shown filters).
Browser/Driver Support
- Axe Reports has been tested and is supported on latest versions of Chrome, Firefox, Safari and Edge.


