What's New in 1.9
Access the Knowledge Base here.
Sign Up to receive the latest updates on axe® Reports in an email.
Bug Fix in 1.9.2
- Resolved Issue with Uploading DevTools Scripts with Multiple Pages On the Same Day
- Trying to upload data for a script with multiple pages (multiple results files with the same script name) on the same day was only importing data for the pages in the last file.
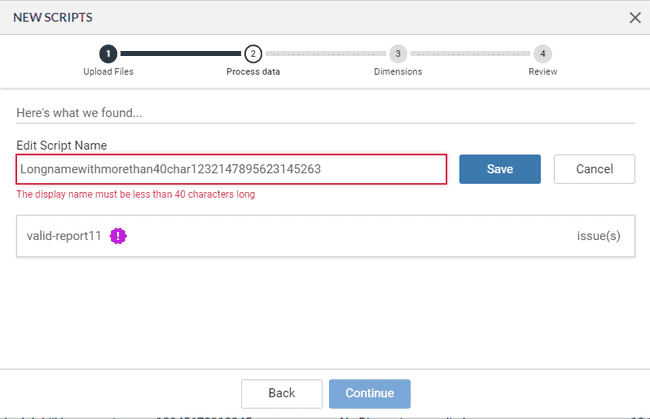
- Resolved Issue of Importing axe DevTools® Script with Long Name Length
- Attempting to import an axe DevTools® script with a name exceeding 40 characters resulted in a failed script upload without triggering a warning message. This is now fixed, and a warning message regarding the long script name is prompted, ensuring a successful upload.
Bug Fix in 1.9.1
-
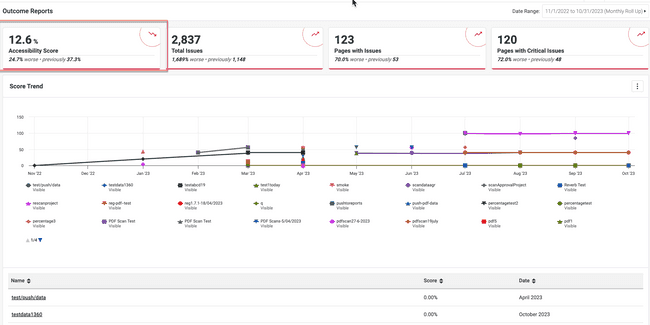
Correct Calculation of Better/Worse Percentage in Accessibility Score Box
- The Better/Worse percentage in the Accessibility Score box which had been simplified to a straightforward difference between the current and previous scans was not being correctly calculated.
-
Allow Import of Scripts with Large Names
What’s New
-
In this release of Axe Reports, the Better/Worse percentage in the Accessibility Score box has been simplified. It is now calculated as a straightforward difference between the current and previous scans, eliminating the previous, more complex ratio-based calculation that caused confusion among users.
-
Previously, on the "Usage by Month" and “Scanned URLs” pages, anonymous users who were not signed into axe DevTools® appeared as blank under the “User” column. With this release, the user name appears as “anonymous user” for users who have not signed in to axeDevTools.
-
For on-premise installations of axe® Reports, support for Red Hat Enterprise Linux 8 operating system, and Microsoft SQL Server 2019 database have been added.
Bug Fixes
-
Multiple A11y bugs were fixed to help ensure a more inclusive and accessible user experience.
-
Specific sections of axe® Reports had missing Japanese translations.
-
When users ran multiple scans in axe Monitor® within a single day, the scan data displayed the new and correct value in the axe Monitor® Project dashboard and displayed an aggregate of the previous and current scans in the axe® Reports dashboard. This has been fixed, and both dashboards display the latest scan result.
-
The sorting feature was not working on several pages within axe® Reports. For instance, the Scan Count column in the Usage reports for Product Components was not working.
-
When there was no data available for export in Usage reports, users trying to export it in CSV format encountered an issue where the exported CSV file included more headers than expected. This problem was noticed on both the "Usage by Month" and "Scanned URL" pages, and within all of their respective inner tables.
-
On the Accessibility Health page, Issue Grouping labels on the Y-axis were clickable and directed the user to the axe Monitor® projects. This caused confusion among the users. This has now been made consistent with other charts (not clickable)
-
When viewing the charts in high contrast mode, the accessibility health charts were not displayed.
-
Trying to import scripts with file names exceeding 40 characters resulted in failure instead of issuing a warning to the user.
-
When users uploaded too many projects in axe® Reports, the labels on the x-axis were missing in the "Issues by Category" section of the Accessibility Health chart.
-
Trying to navigate using the breadcrumbs in the "Issues by Period" chart led to incorrect and unexpected behavior.
Infrastructure Announcements
-
Added support for Red Hat Enterprise Linux 8.
-
Added support for Microsoft SQL Server 2019.
Known Issues
-
Some special characters, like # and ‘ cause issues during the CSV exports even when it is exported in the utf8 format, causing the CSV file to break. Axe Reports currently removes these characters when found during the CSV export process.
-
When an organization administrator deletes a scan or a project/script after applying some filters, the screen refreshes and shows the filter still applied with the table showing all data (irrespective of shown filters).


