
What's New in 2.2
What's New
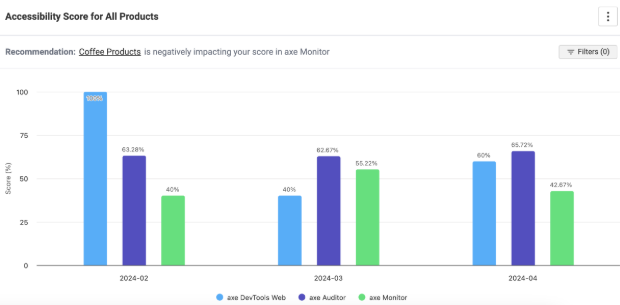
New chart with axe DevTools, Auditor & Monitor Scores
When your organization sends data to axe Reports for multiple axe products (axe Monitor, axe Auditor, or axe DevTools for Web), the Accessibility Program chart will show your progress across the software development lifecycle in one unified view.
Drive targeted improvements across your SDLC
Gain a complete view of accessibility performance across all areas of your business so you can uncover weak spots in development, QA, and production. Assign ownership, direct efforts, and watch your accessibility score climb.
Save time with personalized recommendations.
Cut through the noise with recommendations that tell you where to start making fixes for maximum impact.
Advocate for your accessibility program
Communicate progress to leadership with a clear, user-friendly dashboard. Tell your stakeholders where to invest with the whole story of your accessibility program in one powerful chart. Axe Reports will even help you show how your teams’ hard work is paying off.
Learn more about the Accessibility Program Charts: Accessibility Program
Additional Updates
The navigation user experience is updated, allowing you to more easily navigate between different areas of the axe platform to Axe Reports.
Bug Fixes
- Project, test case and script names longer than 40 characters will show with truncation. The ellipses button can be selected to show the full name.
- When accessibility health and issues by period charts have no accessibility issues, a success message now displays, describing that all pages are clean.
- When the user clicks the Switch Org option while DevTools Mobile or axe Auditor is selected as the product, the application previously switched automatically to DevTools for Web. This issue is resolved and now the product selection remains as expected.
Known Issues
- When there are more than 66 Projects to display on the "Issues by Category" chart in the Accessibility Health Chart section, users encounter a blank page.
- Dimensions with more than 1,000 subdimensions will not display data.