
What's New in 2.3
What's New
Improved Filtering by Multiple Dimensions
Previously, selecting “View By” on Outcome charts restricted users to view content only within that dimension. Now, users can filter by additional dimensions. This allows for easier data slicing, and cross-section reporting. For example, if you’re viewing by “US Sites” in the “Regions” dimension, you can add a filter for a department, product line, or any other dimension you’ve set up.
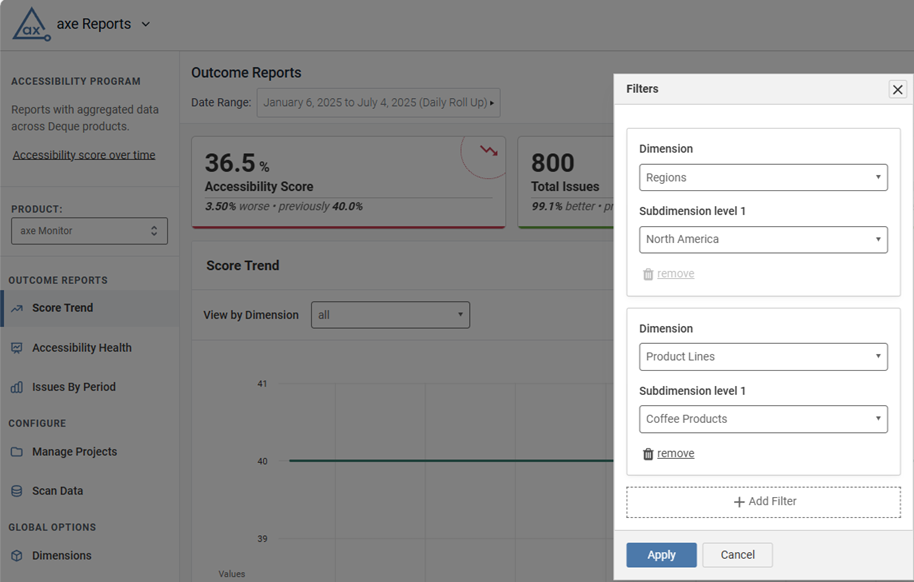
Improved Date Range Selection
The Date range drop-down is now located near chart titles, making it easier to find and modify the date range of your reporting view. The drop-down contents were updated to be more user-friendly as well. Dates now appear in a more understandable format for users outside of the United States.
Bug Fixes 2.3.3
- Team Access now loads properly for all Axe Reports admins.
- On the “Issues by Category” chart in the Accessibility Health section, projects assigned to multiple dimensions were previously counted multiple times in the “All” view, resulting in incorrect totals. This has been corrected. Duplicate projects are only counted once in the “All” view of the Issues by Category chart, and issue counts are now accurate.
Updates 2.3.2
- In the Accessibility Health section, chart titles have been improved to clearly indicate that each chart displays data for the most recent day, week, or month. These charts are not time-based, and the data has not changed. They are now simply more clearly labeled.
- The new Deque logo is now displayed in Axe Reports.
- The Axe Reports database was updated to use MySQL 8.4.
Bug Fix 2.3.1
For admins using Axe Monitor versions 7.5.5 and earlier, on the Manage Projects page in Axe Reports, the Add Projects button previously opened a blank view. This issue is resolved, and admins can now select and add projects successfully.
Bug Fixes 2.3
- Loading times were improved for organizations with large amounts of data.
- Scores between 99.5% and 100% now show as 99%, so that it’s clear that there are accessibility issues remaining.
- Usage reports for Axe DevTools now properly display the scan count.
- Terms such as Filter, Modify, Team Access, Team Name, and Dimensions are now properly translated to French, Spanish, German, and Italian.
- Improved the accessible user experience forusers with disabilities.
Known Issues
- When there are more than 66 Projects to display on the "Issues by Category" chart in the Accessibility Health Chart section, users encounter a blank page.
- Dimensions with more than 1,000 subdimensions will not display data.
- When an organization has permissions modified by product, the "Team Access" page does not load. Contact helpdesk@deque.com if you need to modify your teams' permissions.