
The Scan Overview Page
Navigation: From the main Experimental View page >> Click on the hyperlinked Scan name >> You are on the Scan Overview Page
The Scan Overview page has been designed keeping in mind that the users can have a comprehensive view of a project's scan data in a single page. providing insights into efficiently managing accessibility testing, data visualization, and issue analysis.
To view the Scans List page, activate the Scans link on the top of the page.
Users
- Group (Organization) Administrators
- Group (Organization) Members
- Self-registered axe Monitor® Users
Scan Overview Page - Screenshots
Details of the Scan Overview Page
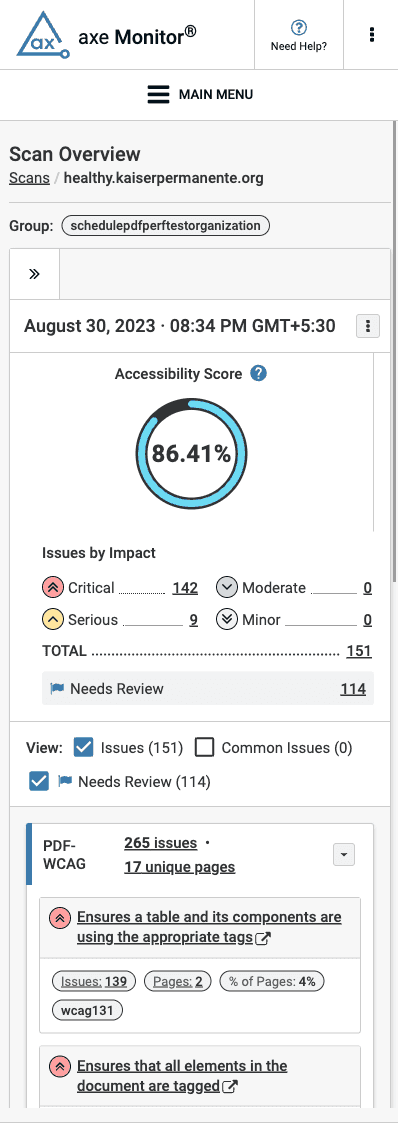
The main body of the page comprises the following sections - details of the scan runs, accessibility score graph, issues by severity, needs review, details of all issues, a page count of the scan runs, and the last scan run's metadata.
Runs
This section displays the most recent six successful scans in the left navigation bar. Information such as the date and time of scan completion, status of the scan completion, total number of issues, and critical issues are shown in the data.
You can show/hide this section using the Show Panel/Hide Panel icon next to the section.
Accessibility Score

The Accessibility Score is displayed as a percentage and is calculated taking into account factors such as total number of pages, number of issues and severity of the issues. Accessibility Score is an average of score for each page in the project (0% for critical, 40% for serious, 80% for moderate, 100% for good).
Understanding How Accessibility Score is Calculated
- Issues are categorized as Critical, Serious, Moderate or Minor.
- Pages are categorized as Critical, Serious, Fair or Good based on the "worst" issue on the page. That is, if a page has one Critical issue, the page is Critical; one Serious issue, the page is Serious; one Moderate issue, the page is Fair; and if a page only contains Minor issues, it is Good.
- The Accessibility Score is based on Page categories and is calculated according the following formula:
- (0.4p2 + 0.8p1 + p0)/ TP where:
p2 = number of Serious pages
p1 = number of Fair pages
p0 = number of Good pages
TP=Total pages
- (0.4p2 + 0.8p1 + p0)/ TP where:
In other words, axe Monitor® gives 40% for a page that has Serious issues, 80% for a page that has Moderate issues, 100% for pages with only Minor issues, and 0% for pages having Critical issues. (Since axe Monitor® gives 0% for pages with critical there is no p3 in the formula.)
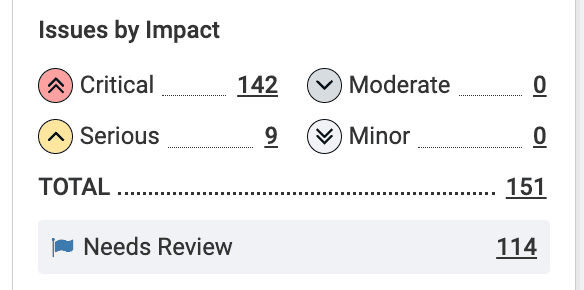
Issues By Impact

This section displays the total number of issues by severity, and the number of issues based on their varying degrees of severity - critical, serious, serious and moderate. The issues displayed here include only the open issues, and not the issues that are marked as Needs Review. Clicking on the count directs you to the Issues page with the applied filters.
Needs Review
The total number of issues marked as Needs Review is displayed here. An issue marked as Needs Review must be verified by a person to conclude whether or not it is an actual Issue.
Clicking on the count directs you to the Issues page with the applied filters.
Note: To know more on Issues and Needs Review, read the topic Issues vs. Needs Review.
Viewing Issues
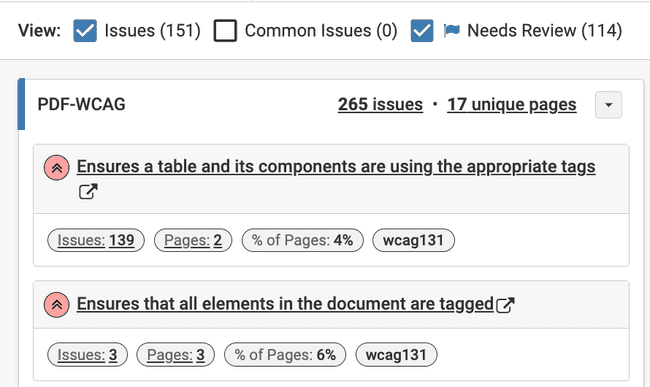
This section displays the details of issues based on the checkbox selected by you: Issues, Common Issues, and Needs Review. By default, the Issues checkbox is selected.
Selecting the checkboxes displays a list of issues with information such as the number of issues, the total number of unique pages scanned, the WCAG rules applied. Clicking the link displays detailed information about the axe rule.
Run Page Count
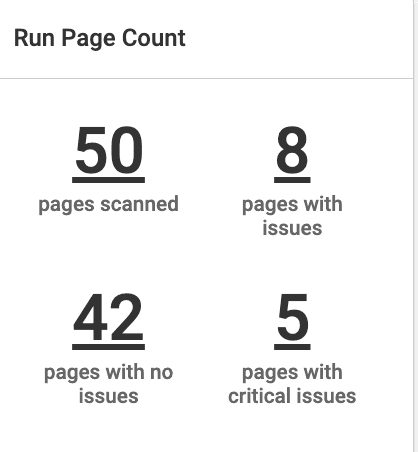
This section displays the cumulative count of scanned pages, pages with issues, pages that have no issues, and pages with critical issues. Clicking on the count directs you to the Pages page with the applied filters.
Run Metadata
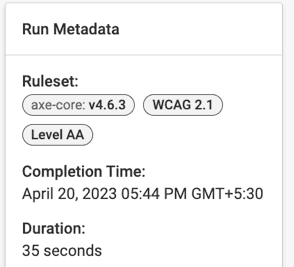
This section displays the metadata of the last run scan. The information contains the rulesets applied while scanning, completion date and time, and the duration for which the scan was run.
Note: The Ruleset details are not displayed for scans that were already run.
Actions on the Scan Overview Page
Upload Issues
Use the Upload Issues option to upload issues to your run. The Needs Review issues will be excluded in the uploaded issues.
You can select only JSON files to upload. The maximum size of the file can be 10 MB, and you can only upload a maximum of 20 files at a time.

To upload issues, do the following:
-
Click the More Run Options and select the Upload Issues option.
-
In the Upload Issues dialog box that comes up, select json files containing the issues to be uploaded.
Note: The uploaded issue uses the 'test name' used in axe DevTools.
-
Click Upload and Save.
Note: To clear and reset the selected files, click the clear and reset link.
Update axe Reports
Use the Update axe Reports option to update axe Reports with the latest scan details of the project. To do this, activate the More Run Options button and then the Update axe Reports option.
This option is visible to the user only after the Include project data has been configured in the axe Reports field in the General Project Settings page in the Classic View. To know more about this, read the topic, Integrating axe Monitor® with axe Reports.