Automated Testing
Before you begin, refer to:
To initiate automated testing:
-
On the Prepare Page for Automated and Manual Testing screen, activate the Open/Send URL button, follow any necessary page access instructions, then click the Start Testing button.
-
When the Automated Testing screen is complete, the Automated Testing page appears, displaying the issues found in the testing. You can rerun the automated tests or start the Manual testing process.
-
Activating the Manual Testing button takes you to the Checkpoint Tests for Page: <Page Name> , showing the Automated testing status of 'complete', with a link to rerun the automated issues.
Checkpoint Result Reassignment
Automated testing can be initiated after manual testing has already been started, and even after checkpoints have had results assigned after being tested manually. It is possible that as a result of automated rules testing, a checkpoint test result can be rendered invalid due to the issues found. Automated testing issues are automatically added to and associated with the most appropriate individual manual testing checkpoints. When such an issue is added to a checkpoint that has already been assigned a manual testing result of Pass or Not Applicable, the checkpoint result must be re-set or reassigned to No Result to allow for the automated testing issue to be associated with the appropriate checkpoint. A message to this effect will appear when such a circumstance occurs.
Skipping Automated Testing
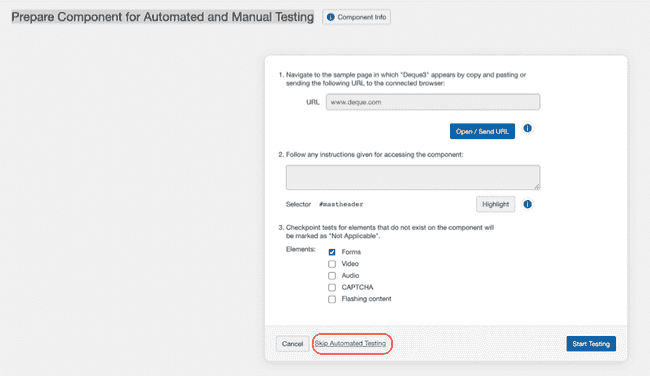
The 'Prepare COmponent for Automated and Manual Testing' screen offers a Skip Automated Testing link, that when activated, will advance you to the 'Prepare (Component or Page) for Manual Testing' screen.
Activate the Skip Automated Testing link.
A message appears that reads, 'Automated testing has been skipped. Automated tests can be run later from the Checkpoint Tests page.'
Continue with preparing the component or page for manual testing. For complete instructions, see Manual Testing.
Automated Testing Results
Note - When No Issues Are Found: A message to that effect is displayed as 'No automated issues were found for this page (or component)'.
Buttons are provided at the bottom of the dialog box that allow you to either Rerun Automated Tests or Go To Manual Tests.
When Issues Are Found and Automated Testing Completes: Accessing the Automated Testing Results screen is done by activating a button from the Automated Testing screen. After automated tests have run, the Automated Testing screen is refreshed to display a completion message indicating the number of issues found. It also displays a link to go to manual tests, along with a Go to Manual Results button.
When You Rerun Automated Tests: A confirmation message is displayed confirming whether you want to run the automated tests again. Activate the button, Yes, Run Again to rerun the automated tests.
The re-run action for automated tests will delete existing automated results prior to running the tests again.

To view results:
- The Automated Testing Results screen displays a system response message indicating number of issues found. Under the message, the screen displays a 3-column table of issue information (ID, Summary & Impact), followed by action options to either re-run them or navigate to the Checkpoint Tests for Page screen to begin manual testing.
- Activate any Summary column link to navigate to the individual
Checkpoint Test screen to view its details and edit the issue, or
activate the Go To Manual Tests button to navigate to the
Checkpoint Tests "hub" screen for the component or page under test
to perform manual testing, as desired.

To interpret the information displayed and understand the action options available, refer to the following descriptions:
- Test Info button: Activate to expand below a section displaying the URL of the page under test with a [Send URL] button, and several fields of information about the page under test, which are based on selections and entries made when the page was added to the test case.
- Message area: The top of the table section displays a message notifying you of how many automated tests were run on the page, and how many issues were found.
- Issue ID column: The automatically-assigned number that uniquely identifies the issue in the axe Auditor system is displayed.
- Summary column link: View a short, summarized description of the issue (the text itself), and activate the underlined link text to cause the Edit Issue dialog box to pop up, which allows you to view additional details about the issue, edit the issue, and save changes.
- Impact column: One of the following is displayed to indicate the level of accessibility impact associated with the issue found: Critical, Serious, Moderate, or Minor.
- Page Navigation buttons: As with most tables of information displayed throughout axe Auditor, the issues table is paginated, meaning you can activate the First, Back, Next or Last buttons to control the view of pages of tabular data.
- Rerun Automated Tests link: This will cause the system to verify the browser connection and then prompt you to send the URL and start testing on the Prepare Page for Automated and Manual Testing screen.
- Go To Manual Tests button: Navigate to the Checkpoint Tests for Page screen, from which you can review the testing status, checkpoints and continue (manual) testing. For complete details, see Checkpoint Tests for Component or Page:<Name>.


