Viewing an Individual Issue
From the Issues For... screen which serves as a summary listing of issues displaying only a subset of fields of information about issues, activate an individual link to access and view all information about an issue (including all of the information that was selected, entered and uploaded for the issue when it was logged) on the View Issue screen. You can view more details and edit an issue, and also take advantage of the fact that each one has its own unique URL. This allows the convenience of sharing a link to an issue with colleagues.
From the Issues For... screen, you are able to view the details associated with an individual logged issue by clicking the ID column link.
To view an issue:
- On the Issues For... screen, in the ID column, activate the Issue link for the desired issue row.
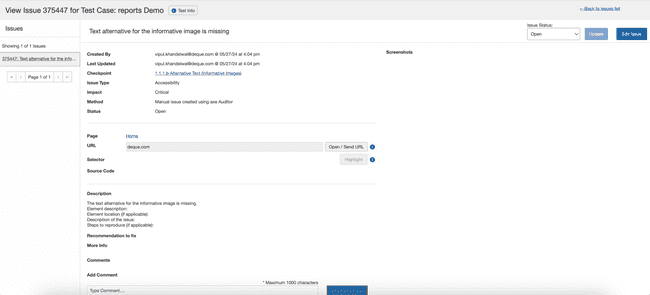
The View Issue <#> for Test Case: <Test Case Name> screen appears, displaying all details associated with the individual logged issue, along with handy buttons that allow you to Edit Issue, Send URL, and Highlight.View Issue Screen Overview
Viewing individual issues in axe Auditor provides all available information logged for an issue on a single screen, along with a button to edit that information if you so choose. A convenient sharing feature is that each View Issue screen has a unique URL that can be sent as a link to a colleague you are collaborating with.
The View Issue <#> for <Test Case Name> screen comprises the following regions in the screen:
- Header area: View the system-assigned issue identification number, associated test case, and navigate back to the 'Issues for...' issues list screen.
- Left sidebar: View the currently-activated filters associated with the issue, view the total number of issues associated with those filters, and click a link to access each issue associated with the active filters.
- Body area: View all fields of information entered and/or selected when the issue was logged, navigate to the associated Checkpoint test screen, and send the Page URL to the testing browser. Fields include Created by, Checkpoint, Issue Type, Impact, Test Run Started, Test Run Completed, Page, Selector, Source Code, Description, and Notes.
- Right sidebar: Modify the existing issue information by clicking a button to display the Edit Issue dialog box, and view screenshots uploaded for the issue.
The View Issue <#> for Test Case: <Test Case Name> screen allows you to:
- View all issue information: See all available information about the logged issue on a single screen, including identifying information (checkpoint, type, impact, date/time), uploaded screenshots, selector, source code, description, remediation notes, etc.
- Checkpoint: Activate the checkpoint link to open the checkpoint details page.
- Send URL to connected browser: Send the URL of the page in which the issue occurs to the connected test browser with the click of a button
- Highlight selector in connected browser: Click a button to instantly highlight the element in which the issue occurs
- Edit the issue: Click a button to open the Edit view of the issue information in order to modify the existing content in editable fields (change selections, entries, and screenshots). For more information, see Editing an Issue.
- Navigate to other issues in the test run: Click links to other View Issue pages in the left sidebar menu to additional numbered View Issue pages for the currently-accessed test run.
- Add Comment: Optionally, you can add a comment, and activate the Add button. You can mention a user by tagging them in the comments. The user then receives a notification. To mention a user (only users with ability to create issues can be tagged) using autocomplete, type '@' in the editor, then start typing their name. Choose the user you want to mention from the list of suggestions.
Alternate Method: The View Issue screen can also be accessed from an individual Checkpoint Test screen via the "issue logged" message link:


