
The Summary Page
View summary information about your project's accessibility issues
The summary page shows the issues associated with a test run. The test run is associated with a particular commit (when used with Git) or a time and date (when used without Git).
The summary page appears as follows:
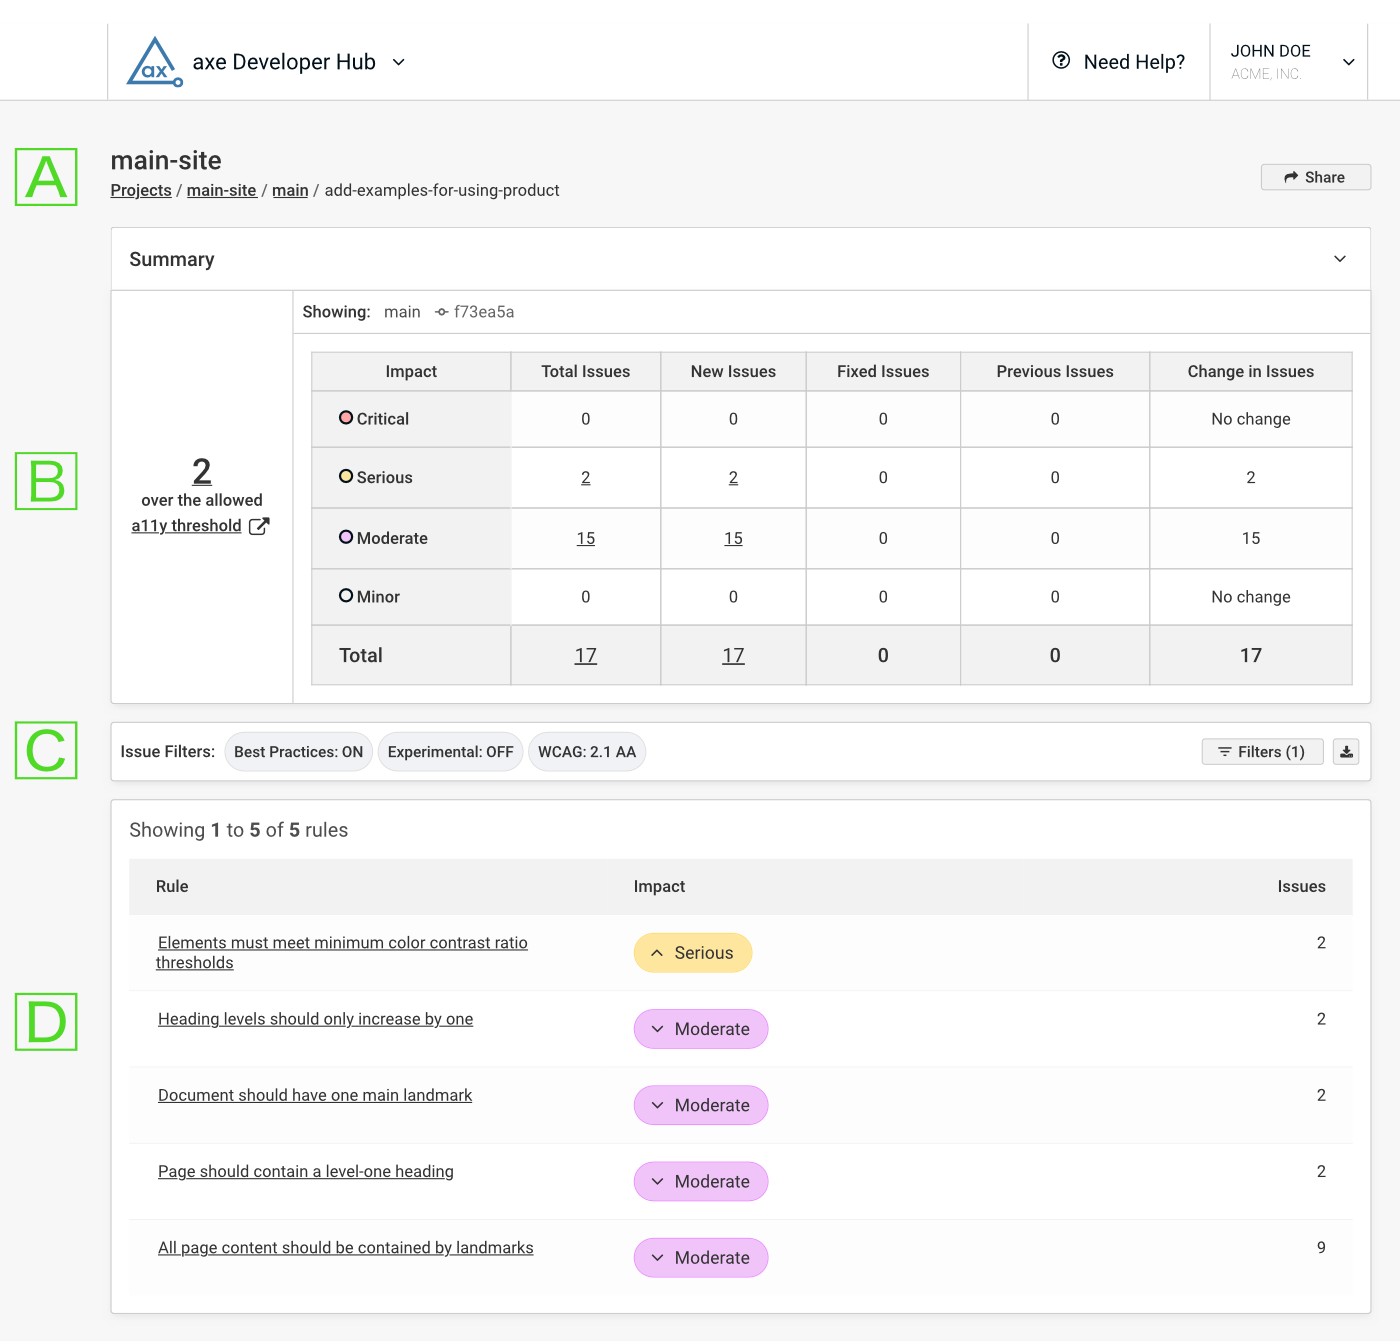
🄰: Summary Page Breadcrumb

Underneath the current project's name is the breadcrumb path (showing the navigation path to the current page). On the right is the share button.
The components of the path are, from left to right:
- Top-level link to the Projects page, which shows your axe Developer Hub projects
- Link to this project, main-site, which shows the branches in this project (Git) or test runs (Gitless)
- (For Git projects) a link to the Git branch, main, which shows the commits in this branch or (for Gitless projects) the date and time of the test run
- (For Git projects) the message associated with this commit (add-examples-for-using-product), (for example, this commit was created with command-line Git as
git commit -m "add-examples-for-using-product") or (for Gitless projects) omitted
The Share button (on the right) copies a link to the current page to your clipboard, allowing you to send it to others.
🄱: The Results Summary
The next section of the report is the summary, as shown below:
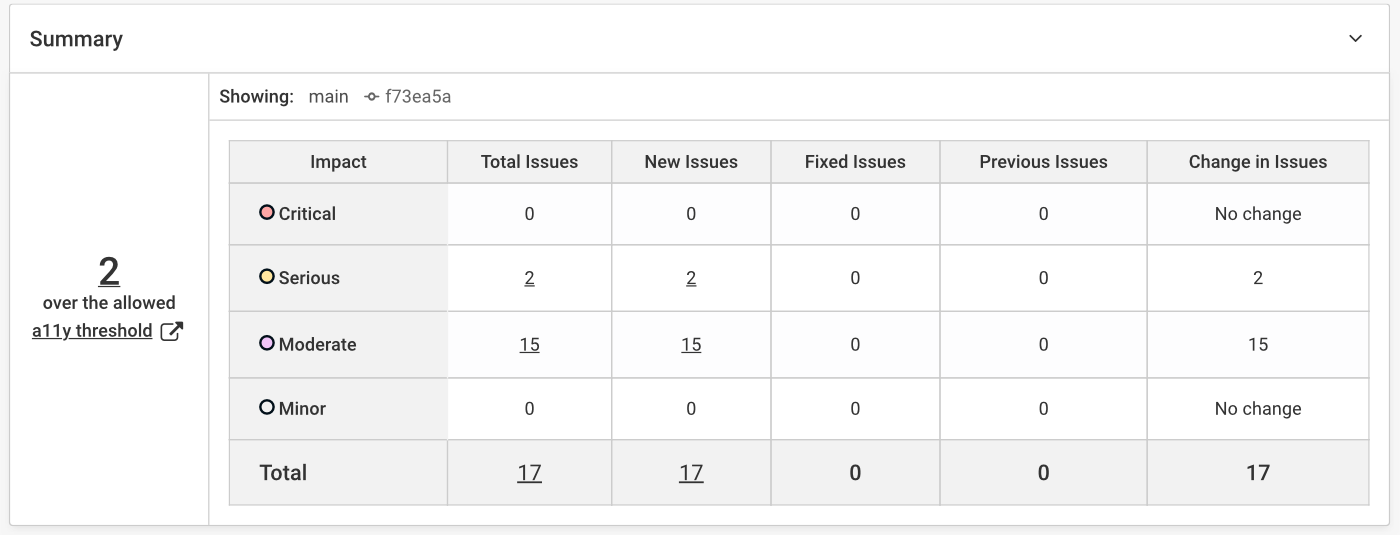
At the top, for Git projects, the commit's message and SHA appear next to Comparing: along with the commit message and SHA of the commit it's comparing to. For Gitless projects, the date and time of the latest test run and the previous test run are compared.
If there is nothing to compare (no previous commit for Git projects or no previous test run for Gitless projects), Showing: will appear with the commit message and SHA (for Git projects) or the date and time of the test run (for Gitless projects).
On the left is the number of accessibility defects above a set threshold. On the right is a table of defects grouped by impact. Clicking on a number in the table sets a filter to show only those issues. See 🄲: The Filter Selector and Page State Control below for more information about filtering.
To compute the change in issues, axe Developer Hub follows this procedure:
- Compares this commit to the previous commit in the same branch (when you navigate here from the commits page).
- Compares this commit to the head commit in the default branch (when you navigate here from the branches page).
- Compares this test run to the last test run (when you navigate here from the test runs page page).
- Performs no comparison. This case occurs, for instance, if this is the first commit (Git) or there are no other branches (Git) or there are no other test runs (Gitless). All issues are considered new in this case, and the header will read Showing: instead of Comparing:.
🄲: The Filter Selector and Page State Control
This section shows the selected filters and provides a button to change filters and the page state control.

The current filters are in the top section on the left. On the right is the filter selection button, followed by the export issues button. The bottom section allows you to choose a page state or all page states to show the issues.
Filter Selection Button
The filter selection button shows the dialog below:
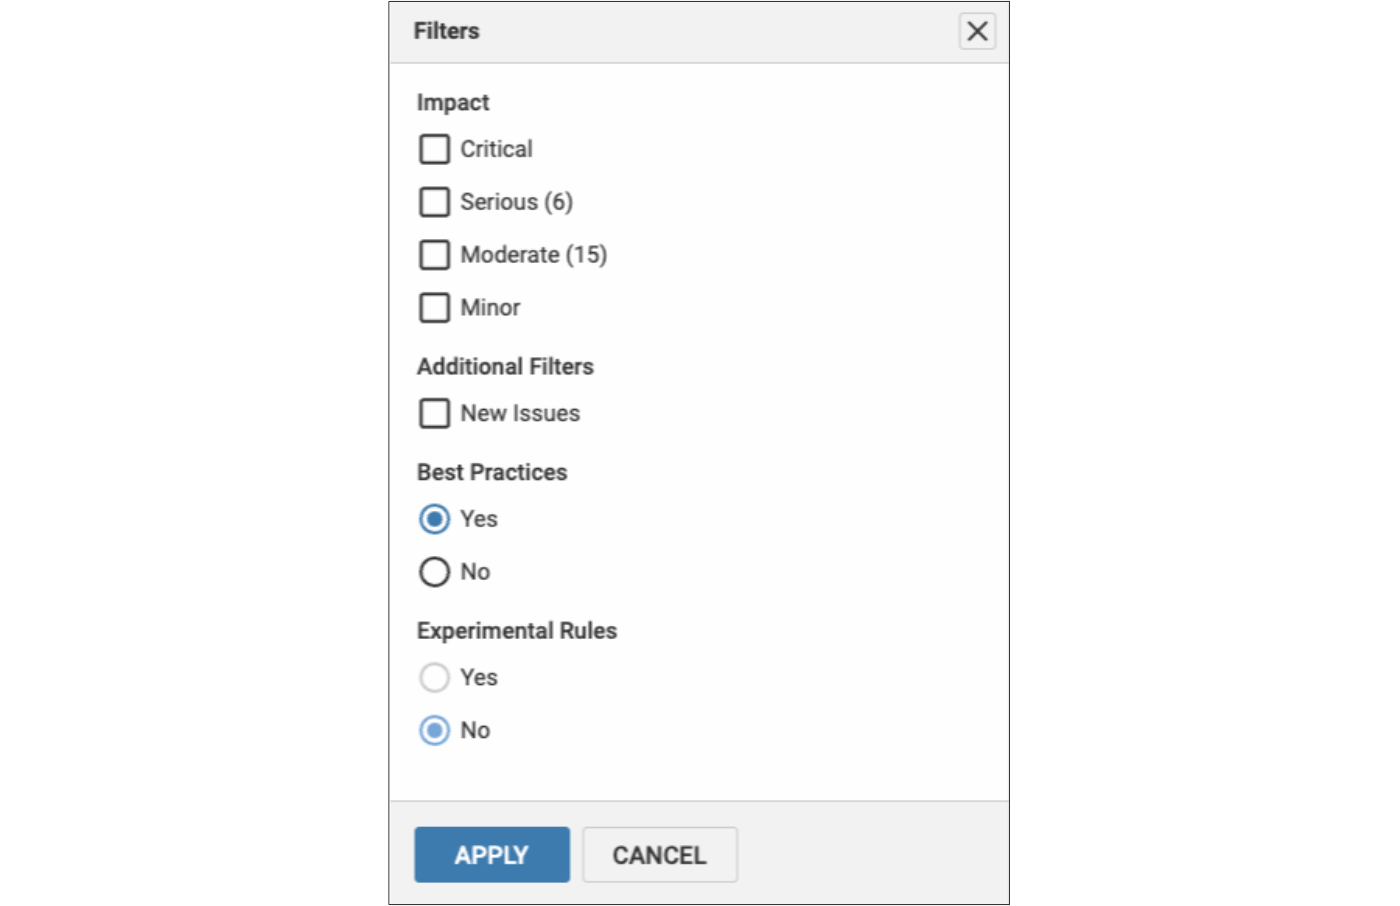
The filters dialog allows you to filter the accessibility results:
- By impact: The number of issues in each impact level appears in parentheses after each impact level.
- Whether they're new issues: Issues are considered new if they appear in the current commit (if using Git) or test run (if not using Git) but not in the previous commit or test run.
- Whether they're best practices violations
- Whether they were triggered by experimental rules violations
Export Issues Button
By clicking on the export issues button, you will see the following dialog:
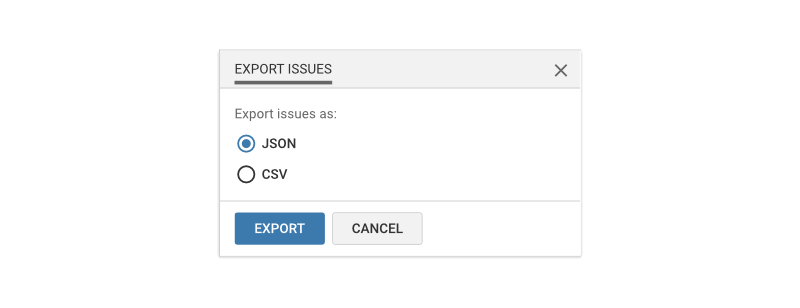
For more information on exporting, see Exporting from axe Developer Hub
The Page State Control
The page state control allows you to select among all of the recorded page states. The default selection is All page states. Each page state is numbered and includes:
- The time difference between the start of the test run and when the page state occurred
- The page title when the page state was captured
- The URL visited by the test suite (shortened for later page states)
- A count of the unique accessibility issues that occurred during that page state.
🄳: Rules Summary Table
The last section of the report shows a table of each rule violation, its impact, and the number of violations found on the page that was scanned:
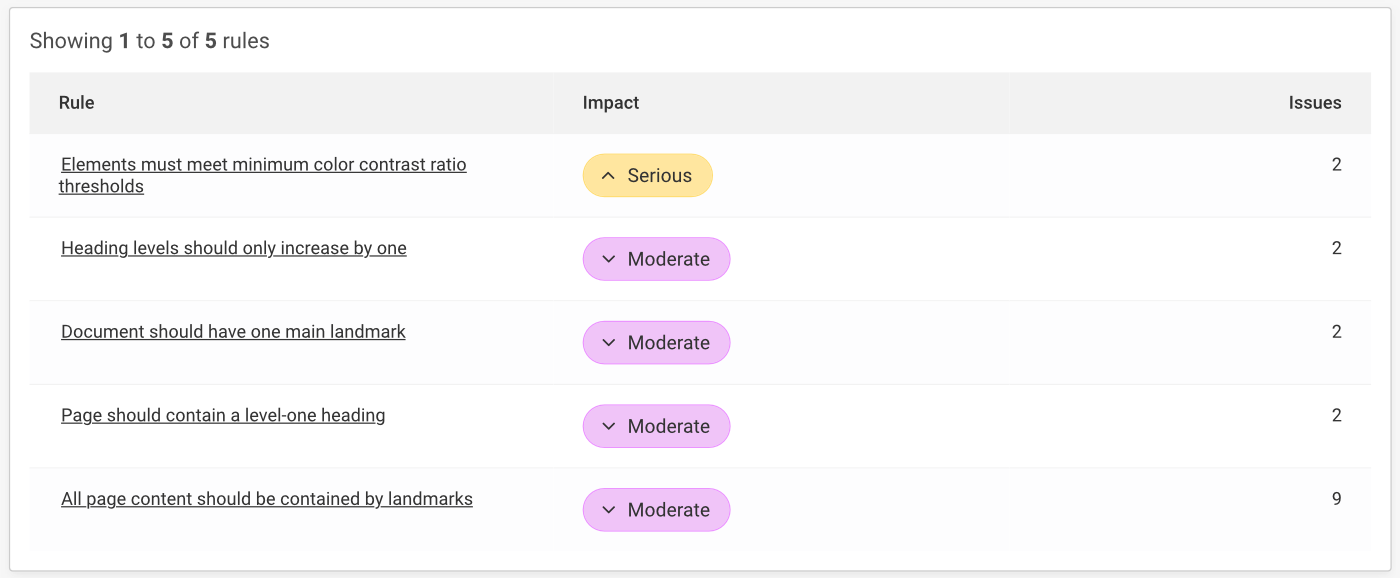
Clicking on a rule will take you to the Details Page where you can find out more information on the violation and step through each violation of the selected rule.