Accessibility Health Chart
The Accessibility Health chart displays data in three different ways:
- Issues by Category
- Issues by Severity
- Pages with Issues
You can also view the data as a table, and export the data into a CSV or JSON file.
Issues by Category
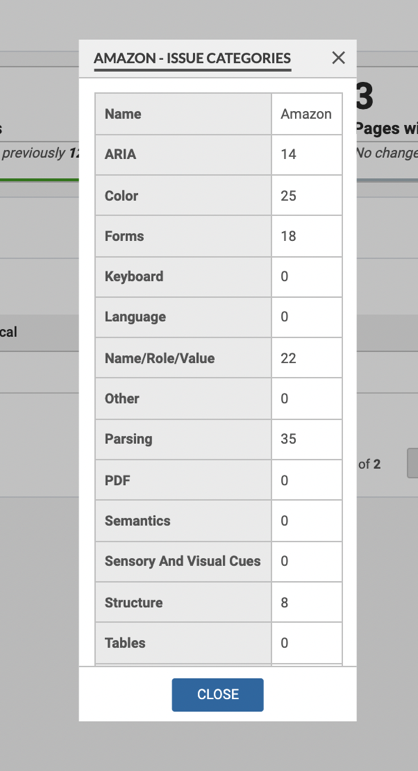
This Bubble Chart provides a view into the total number of accessibility violations found within the selected hierarchy level by Fifteen (15) actionable categories. The categories are (alphabetical order):
-
Aria
-
Color
-
Forms
-
Keyboard
-
Language
-
Name, Role, Value
-
Other
-
Parsing
-
PDF
-
Semantics
-
Sensory and Visual Cues
-
Structure
-
Tables
-
Text Alternatives
-
Time and Media
The colour of the bubble is reflective of the total number of violations found in that Issue Group. The counts provide the count of issues for each category.
Issues by Severity
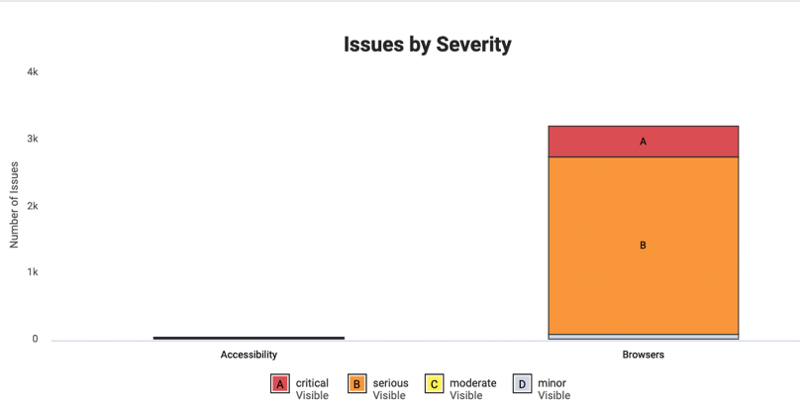
This chart captures the total number of accessibility issues captured at the selected level of hierarchy by issue severity. Currently supported issue severity levels are:
-
Critical
-
Serious
-
Moderate, and
-
Minor
This information is presented in a Grouped Bar Chart format, by default.
Selecting any bar in the chart triggers a drill down into the comprising hierarchy levels. Selecting the severity level control in the legend provides a filtered view on the same chart filtered by the selected severity.
You can select or deselect the severity icon below the graph to view or remove the type of severity from the graph.
Selecting the leaf node (Does not apply to axe DevTools charts) opens a new browser tab/window to navigate you to the comprising axe Monitor® Project or axe Auditor Test Case for this leaf node.
Pages with Issues
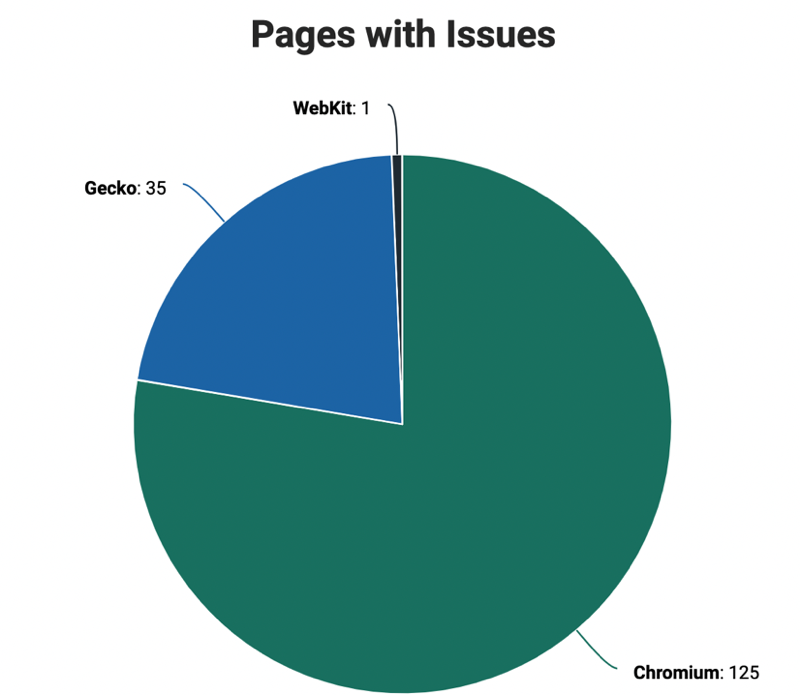
You can find the number of pages with any accessibility violation within each unit of the selected hierarchy level with this Donut Chart. Within an organization this chart can provide you with a sense of workload for each unit.
You can drill-down into the comprising levels for a unit by clicking on that specific unit.
This chart also includes a data table view as available with the previous charts that can be triggered using the Kebab menu. The information included in the data table includes the name of the unit, Count of pages with any accessibility violation, a 'Drill-Down' button for each row (for non-leaf nodes).
Selecting the leaf node (not applicable for axe DevTools charts) opens a new browser tab/window to navigate you to the data comprising axe Monitor Project for this leaf node.
View Accessibility Health as a Table
Use the kebab menu option (three dots) on the right of the screen and select View as Table to view accessibility health as a table.
The Data Table view in this Chart provides the number of accessibility violations for each unit that comprises the selected hierarchy level. Columns include Unit Name, Number of Critical Issues, Number of Serious Issues, Number of Moderate Issues, Number of Minor Issues, and a column to provide 'Drill Down' button (if not at Project/Script Level).
Click the eye icon under the Actions column to view the issue categories of the Script.


