
Understanding Dimensions
Overview
Dimensions provide a flexible and powerful way to organize your reporting, allowing your business units to focus on their unique accessibility goals.
Admins in axe Reports can create Dimensions based on the different categories you may want to review your data. For example you may want to view your accessibility Scan data by Department, Brand or Region. Creating three Dimensions for Departments, Brands and Regions would allow you to pinpoint where the accessibility risks are in your organization, so that you can narrow in on areas for improvement. Setting up Dimensions in axe Reports will help you problem solve with your teams, business areas and offices, and make measurable improvements toward your accessibility goals.
Example Use Case
A globally distributed company may choose to create Dimensions for Divisions, Regions, and Departments.
| Dimension Name | Subdimensions |
|---|---|
| Division | TV, Radio, Print |
| Regions | United States, Europe, Asia |
| Departments | Marketing, News, Design |
A single website that you Scan for accessibility issues may be assigned to multiple Dimensions - for example, ABC.com may be assigned to ABC in “Divisions,” United States in “Regions” and News in “Departments.”
How to Use Charts with Dimensions
Broad Trends Across Your Organization
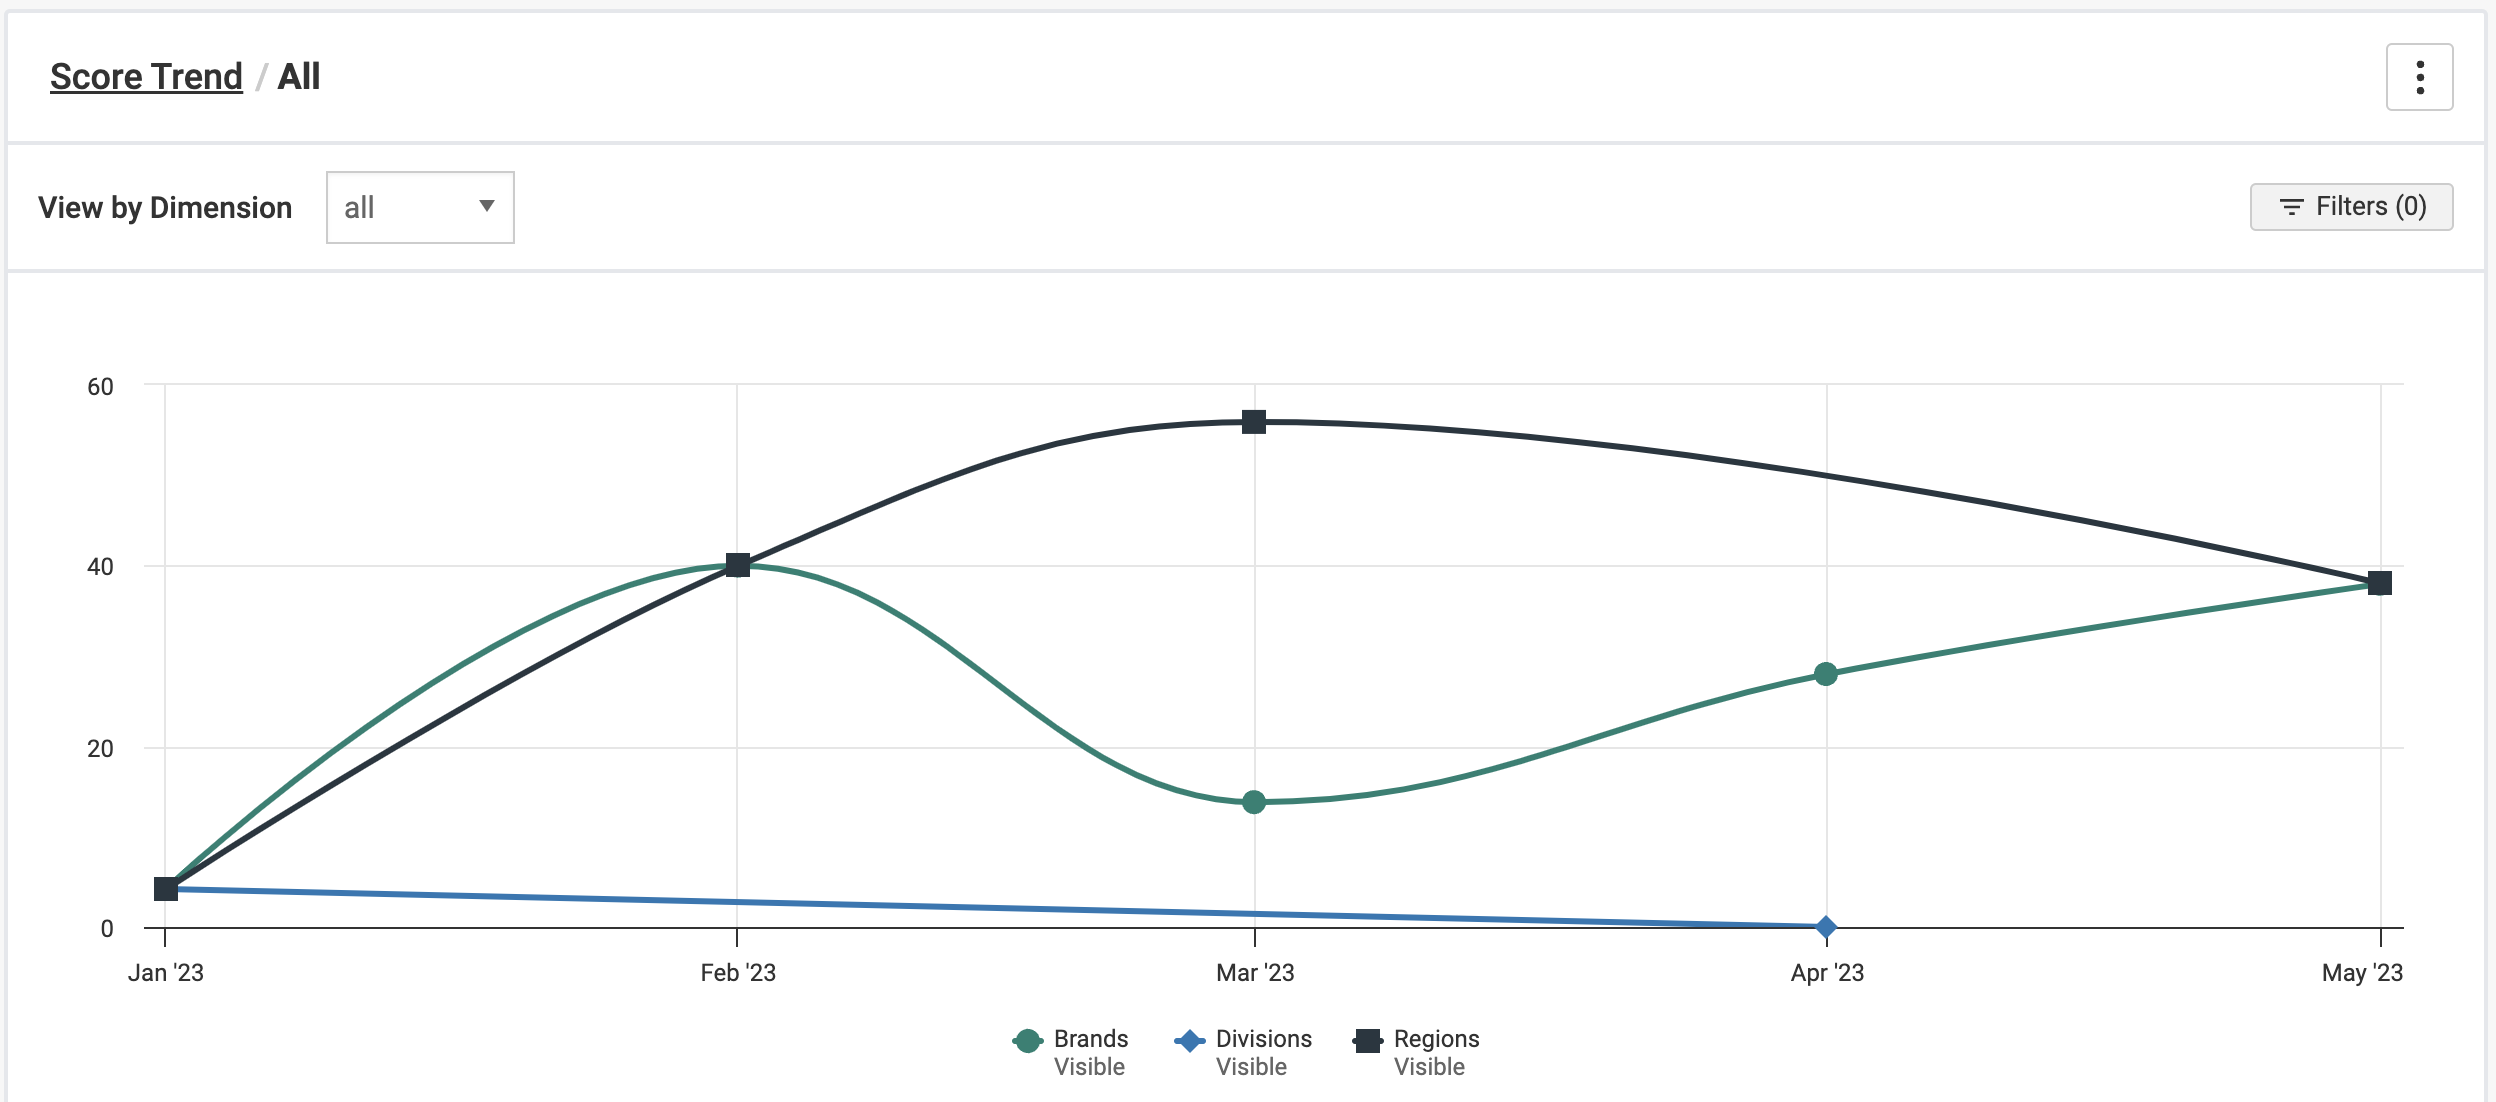
When you log into axe Reports, you get a single Score Trend line across all your Dimensions, Scans, Test Cases and Scripts. Select a point on the chart or table to view trends for individual Dimensions or Projects. This “bird’s eye view” will give you a high-level idea of which areas in your organization need more attention.
Make Comparisons Within a Dimension
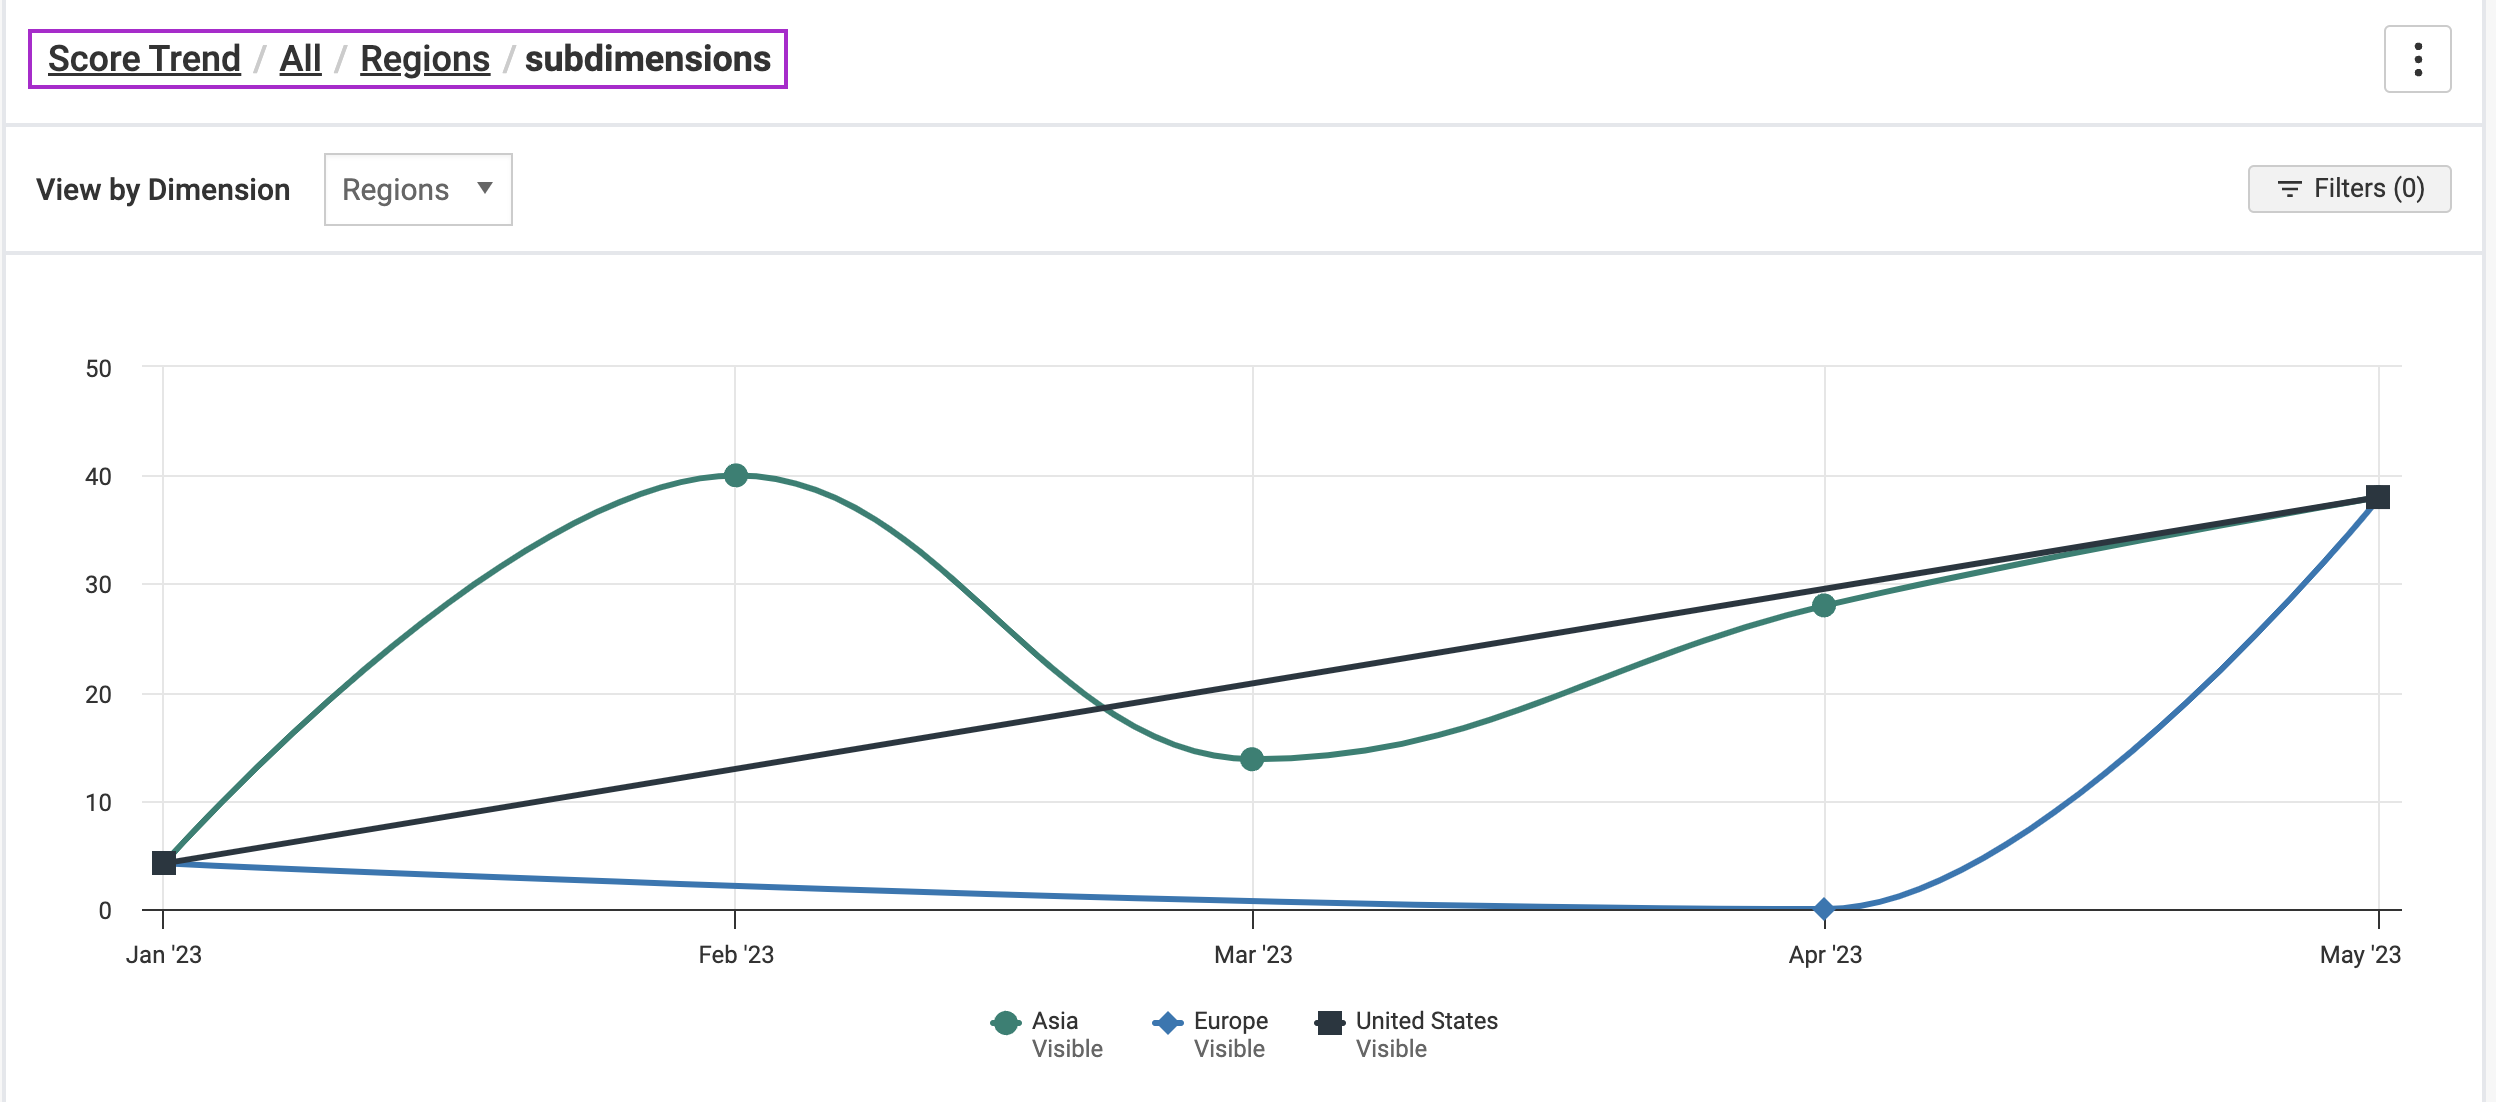
To compare accessibility across your Divisions, select View By from the chart dropdown. Select a point on the chart or table to continue drilling into your desired hierarchy. You may notice that certain divisions are improving faster than others. You can use this information to learn from the successful divisions at your company. Or, you can use this comparison to understand which divisions need more focused attention on accessibility.
Narrow in on Improvements Across Dimensions
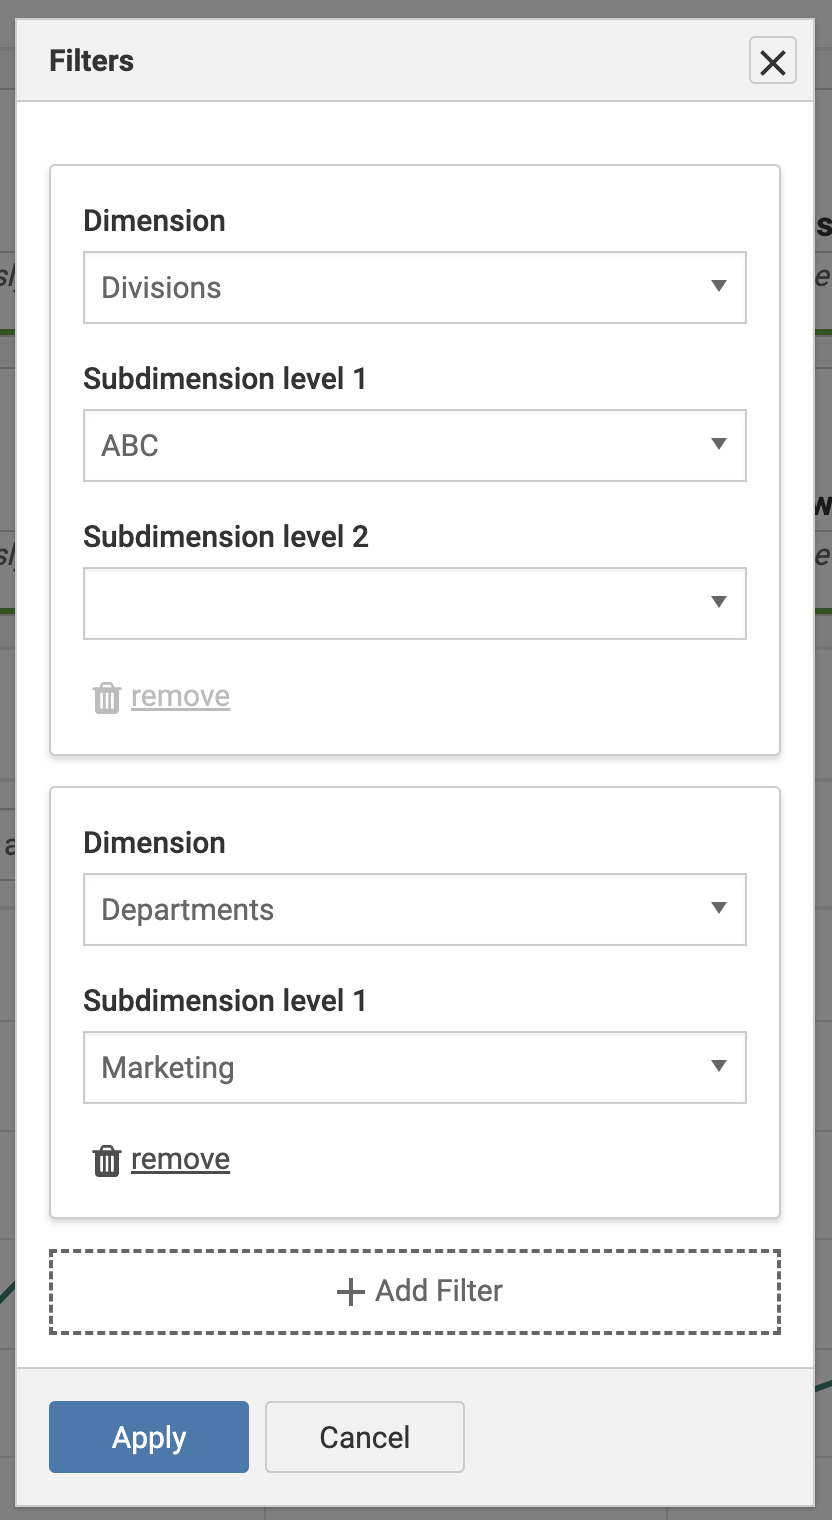
You may notice that your “Marketing” Department has declining accessibility scores on the websites they manage. To understand more specifics on where those scores are coming from, use the Filter button for any Outcome Report. Filter to the Department Dimension, then “Marketing”. Add a Dimension, such as Division. This will show the cross-section of data available if you’ve added Scans to both Dimensions. This will show you which Divisions your Marketing team should focus on improving accessibility first.
Requirements
- Top-level Dimension names and Subdimension names must be unique and can contain up to forty characters.
- There is no limit to the number of Scans, Test Cases, or Scripts you can add to a Dimension.
- Subdimensions can be nested up to five levels deep so that you can drill into accessibility reporting within specific business areas.
- Subdimensions can contain a mix of Scans from axe Monitor, Test Cases from axe Auditor, and Scripts from axe DevTools for Web.