
What's New in 2.0
Axe Reports 2.0 allows you to create more dynamic Dimensions, so you can pinpoint precisely where the accessibility risks are in your organization, and narrow in on areas for improvement.
What's New
Dimensions with New Capabilities
Dimensions can be created based on the different categories you may want to review your accessibility progress. For example, you may want to view your accessibility Scan data by Department, Brand, or Region. Setting up Dimensions in axe Reports allows you to collaborate more effectively with your teams, business areas, and offices, and make measurable improvements toward your accessibility goals.
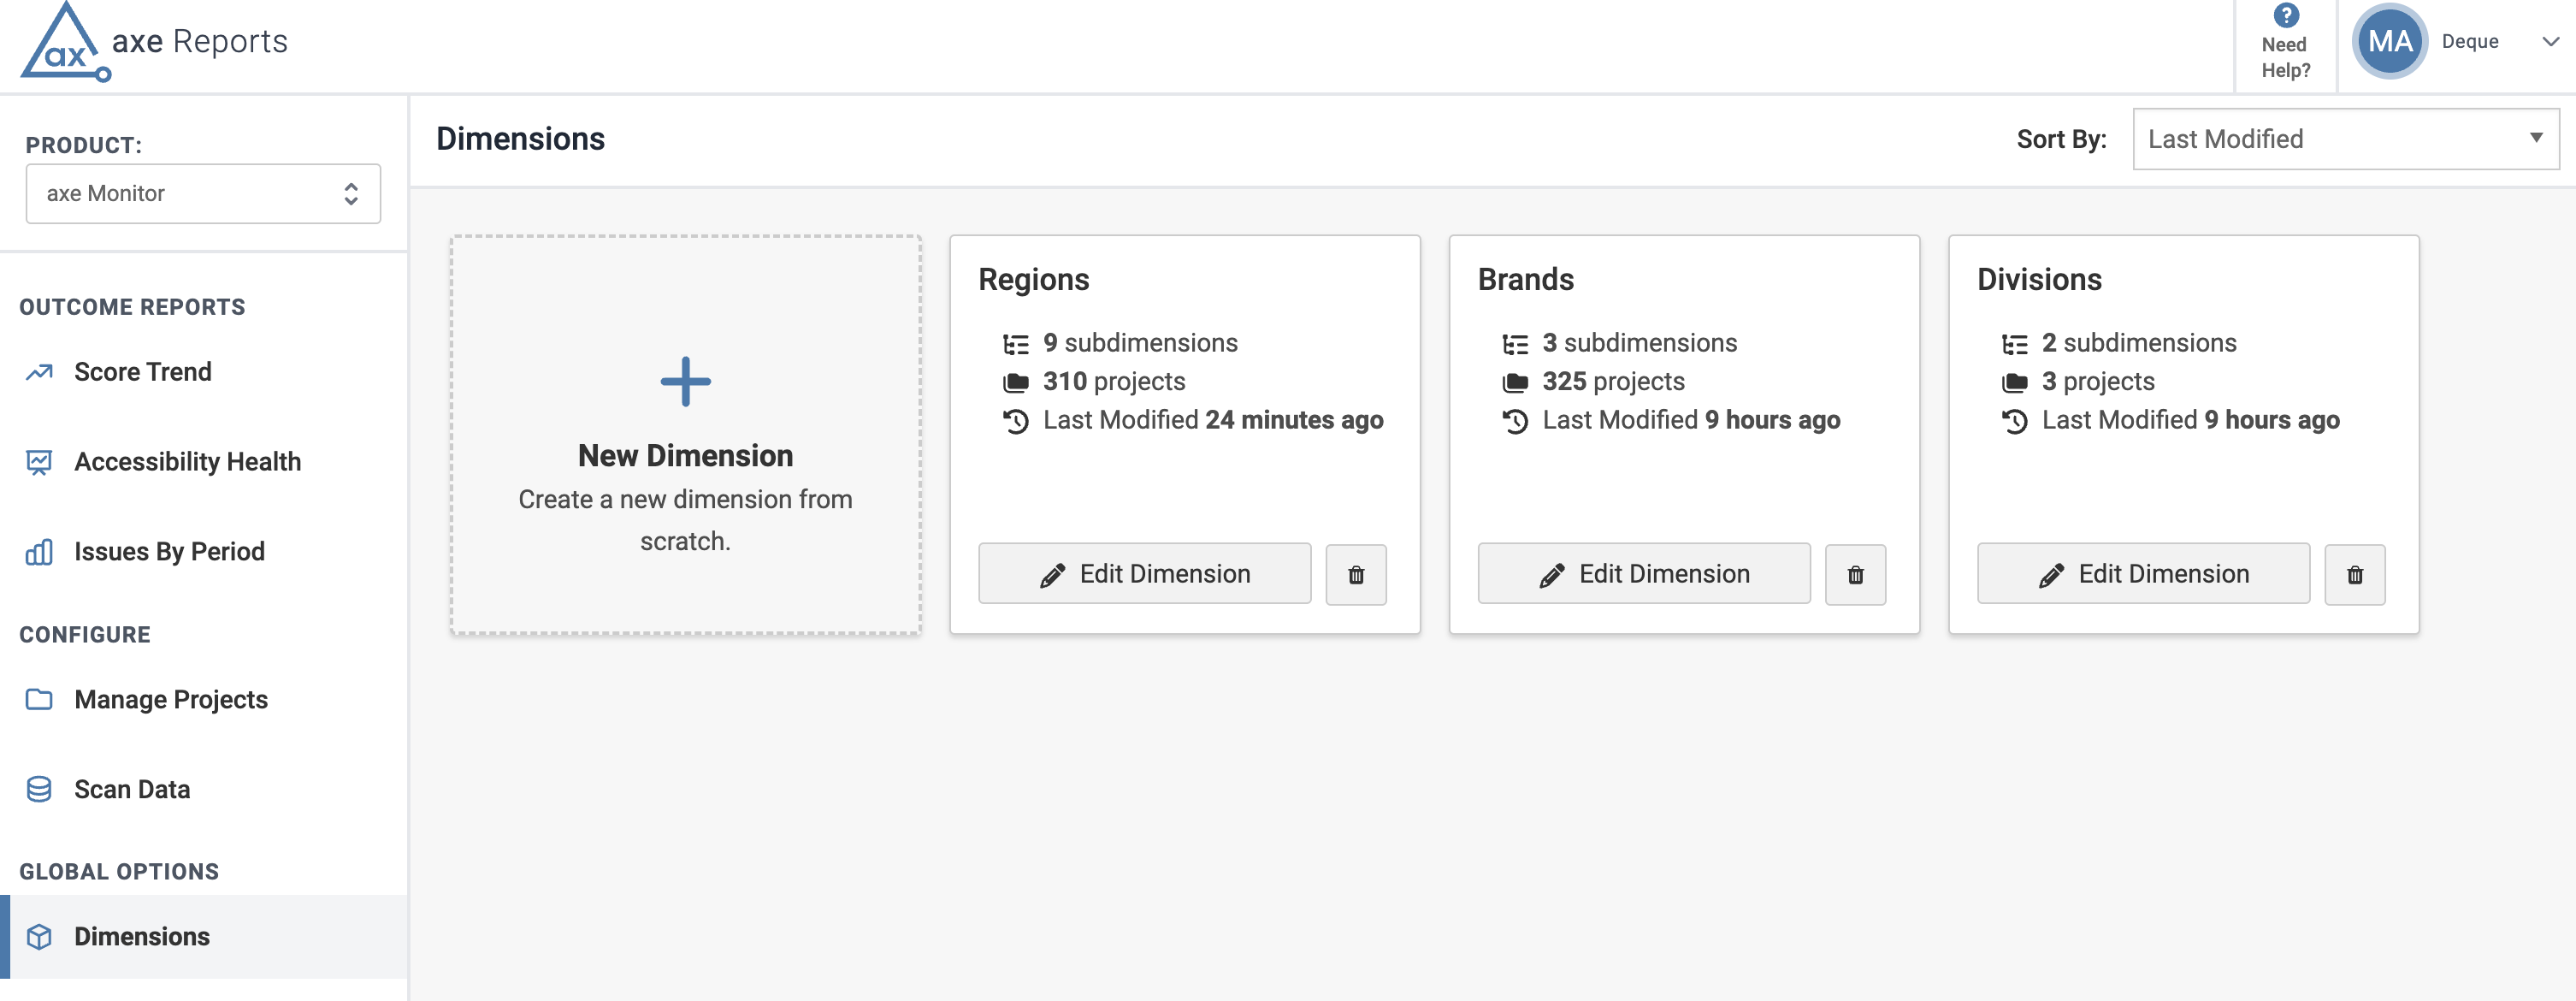
Global Dimensions Across axe Products
Axe Reports admins can now add axe Monitor Scans, axe Auditor Test Cases, and axe DevTools for Web Scripts to a single Dimension. Add or edit Dimensions from the Global Options menu. Assigned Scans or Test Cases are displayed based on the selected product.
Note: Due to a bug in axe Reports, a single Dimension cannot contain axe Monitor Projects, axe Auditor Test Cases, and axe DevTools Scripts. The Deque team is working on a fix. Please avoid combining Projects, Test Cases, and Scripts in a single Dimension until this is resolved.
Learn more about setting up Dimensions
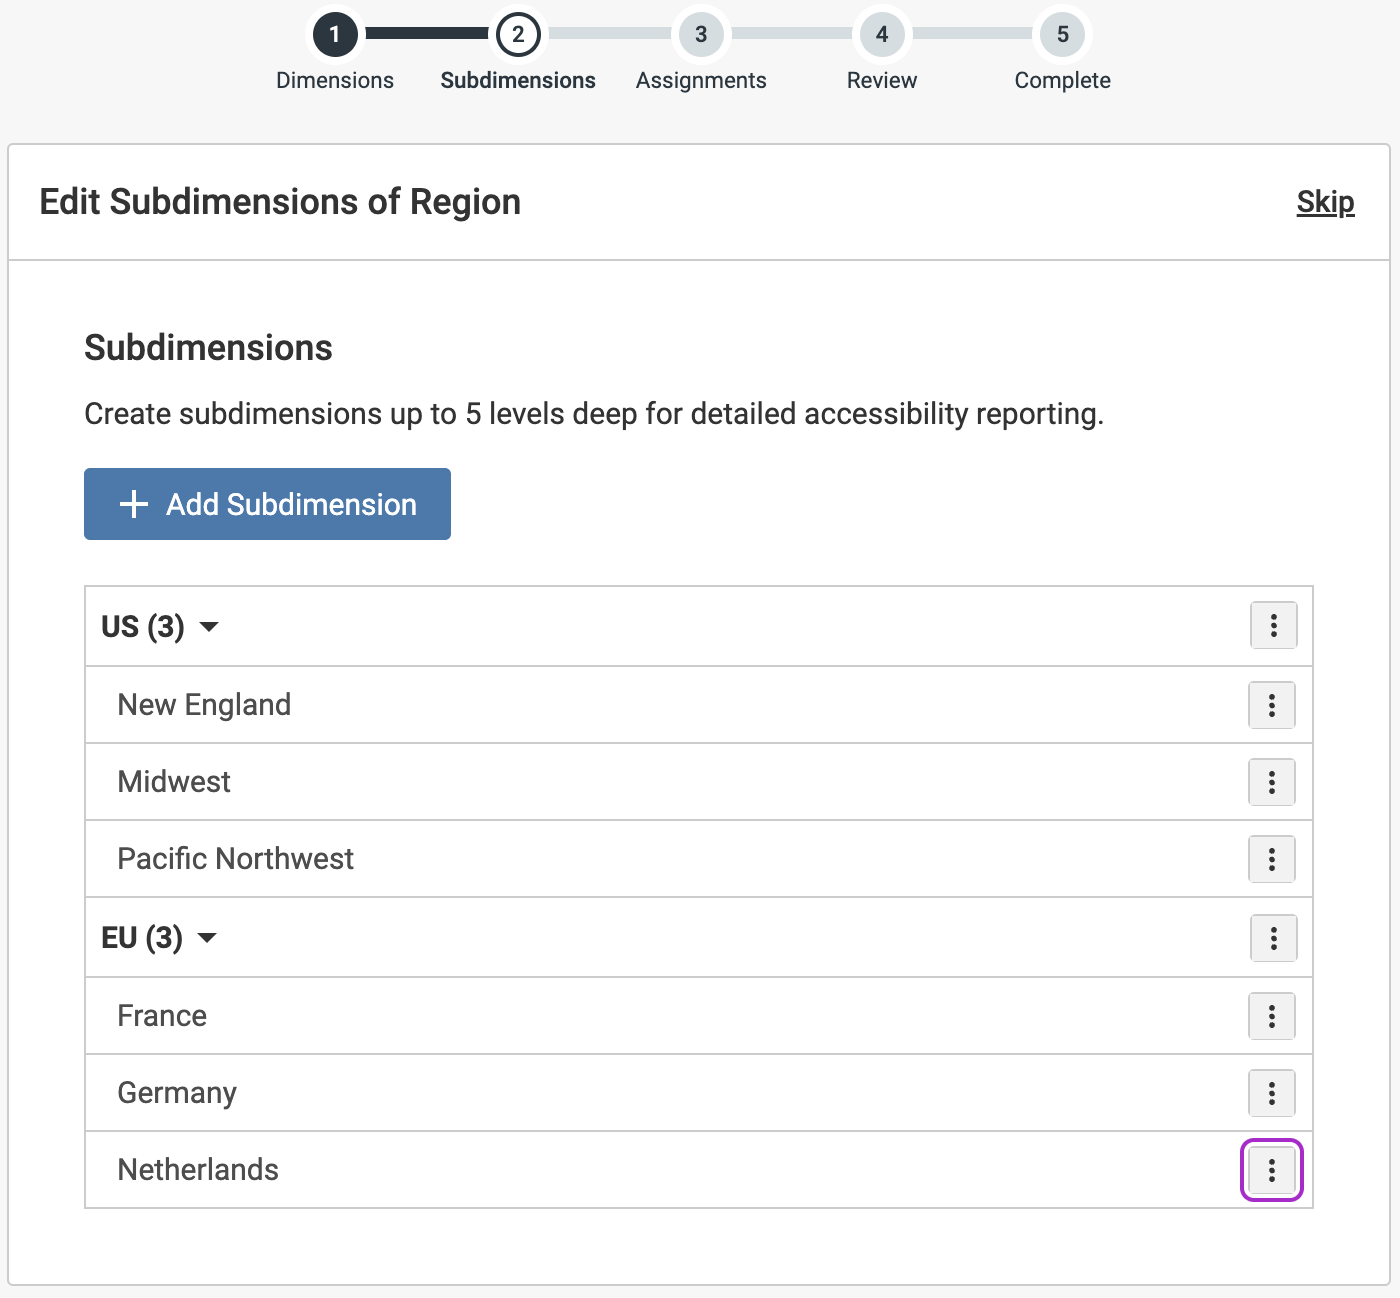
Drill-down with Subdimensions
Dimensions now include Subdimensions, that allow you to drill down into more specific categories, such as individual Regional offerings. Subdimensions can be nested up to five levels deep for detailed accessibility reporting. Each Dimension must contain at least one Subdimension.
Assignment to Multiple Dimensions
Axe Reports admins can now assign single Scans, Test Cases, and Scripts to multiple Dimensions, enabling more versatile reporting. For example, a Scan like “Talento Gelato Site” can simultaneously be part of the “Marketing,” “EU,” and “United States” Dimensions.
Powerful Insights on Outcome Reports
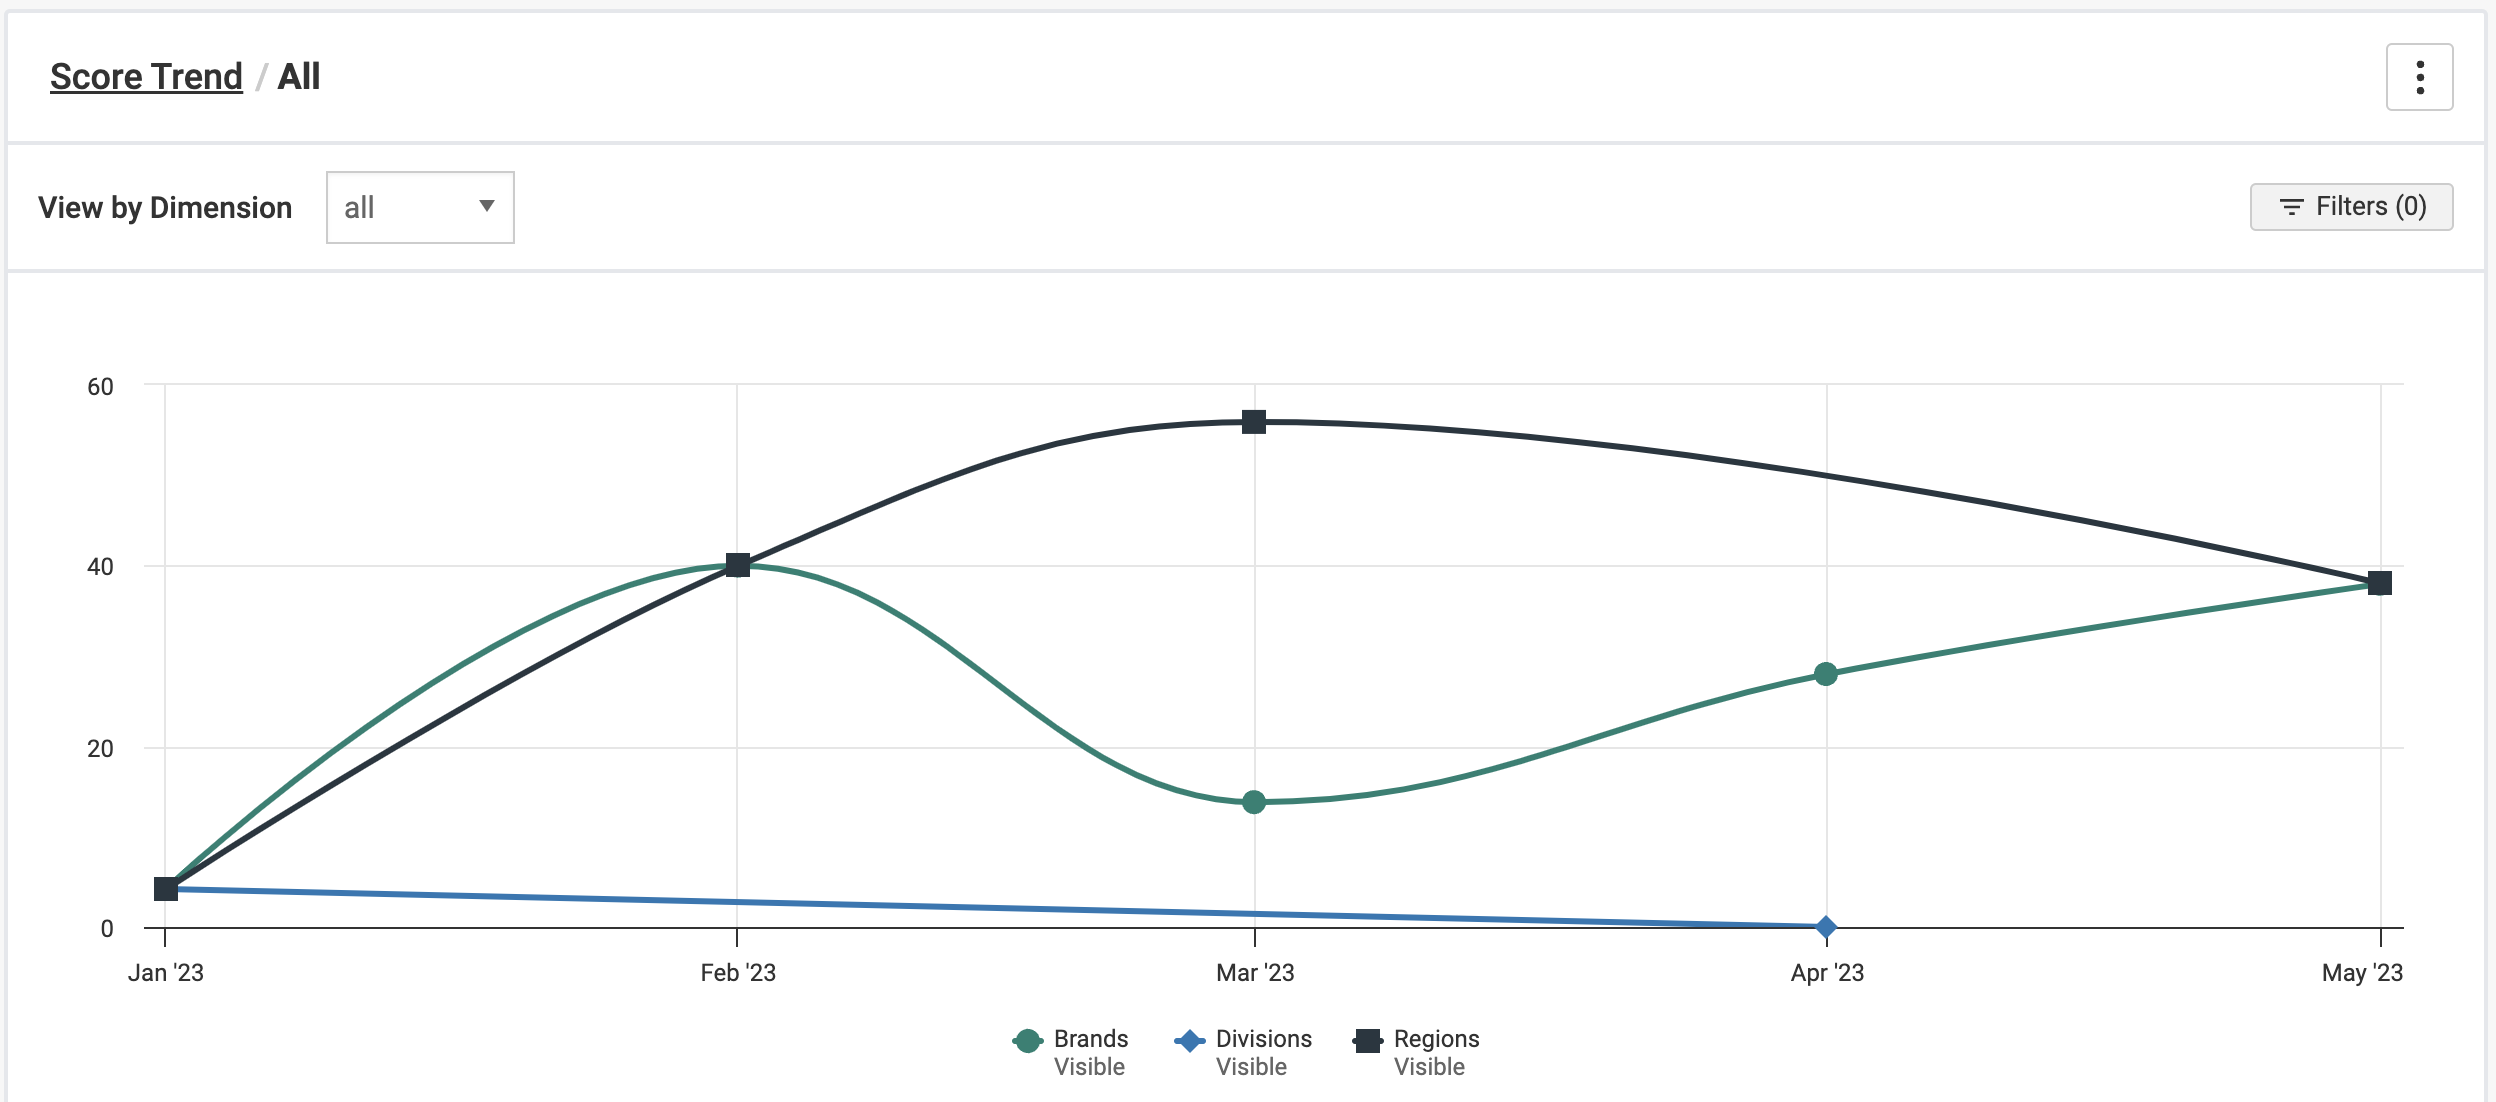
Broad Trends Across Your Organization
When you log into axe Reports, you get a single Score Trend line across all your Dimensions, Scans, Test Cases, and Scripts. Select a point on the chart or table to view trends for individual Dimensions or Projects. This “bird’s eye view” gives you a high-level idea of which areas in your organization need more attention.
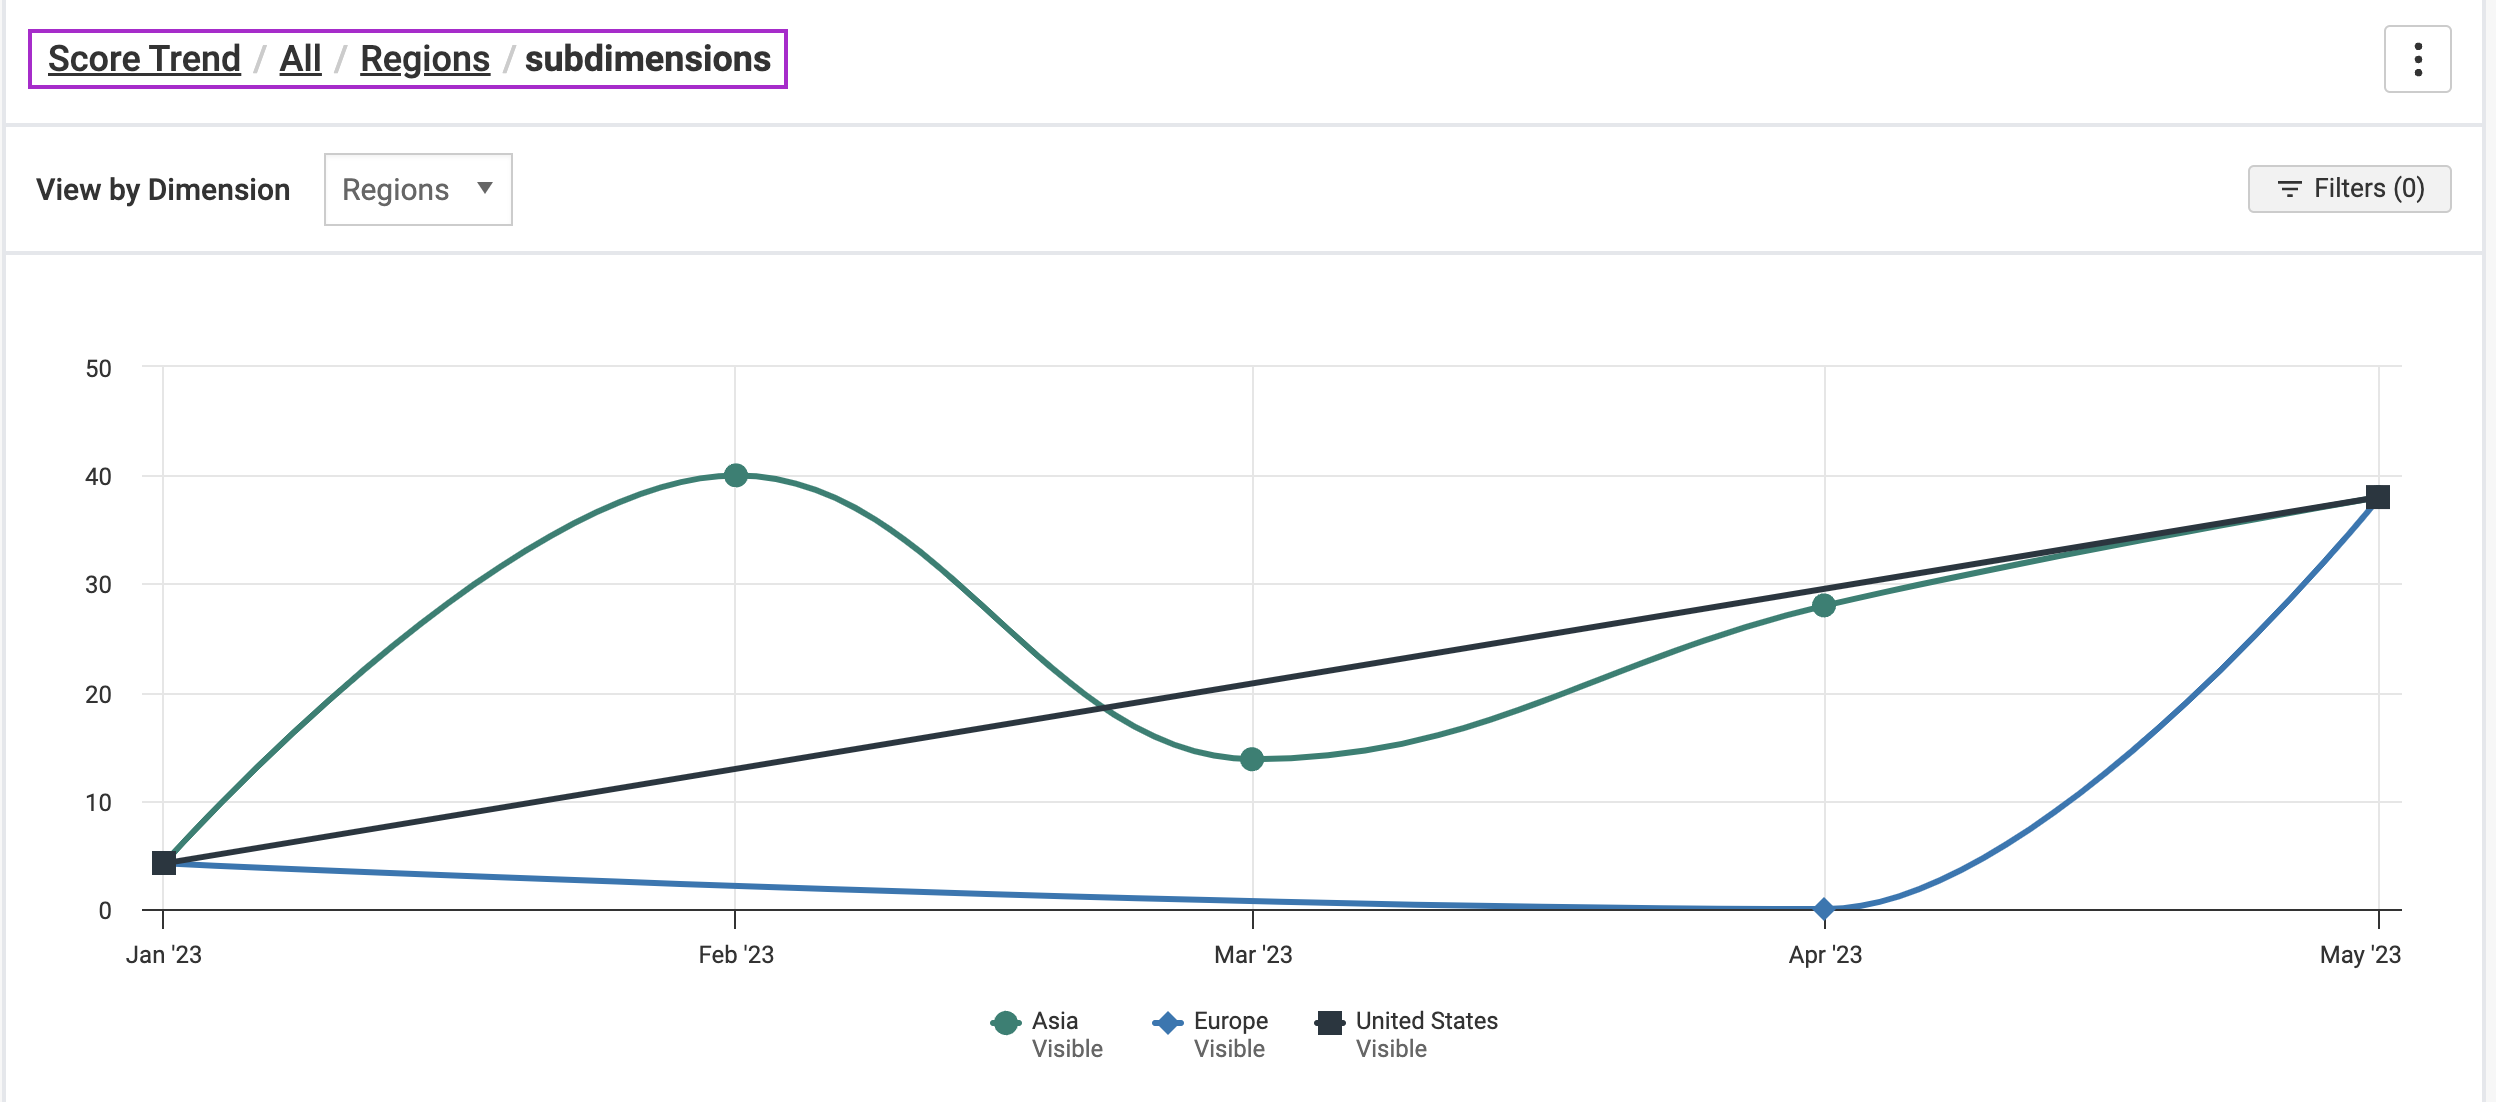
Make Comparisons Within a Dimension
To compare accessibility across your Divisions, select from the new View By chart dropdown. Select a point on the chart or table to continue drilling into your desired hierarchy. You may notice that certain divisions are improving faster than others. You can use this information to learn from the successful divisions at your company. You can also use this comparison to understand which divisions need more attention focused on accessibility.
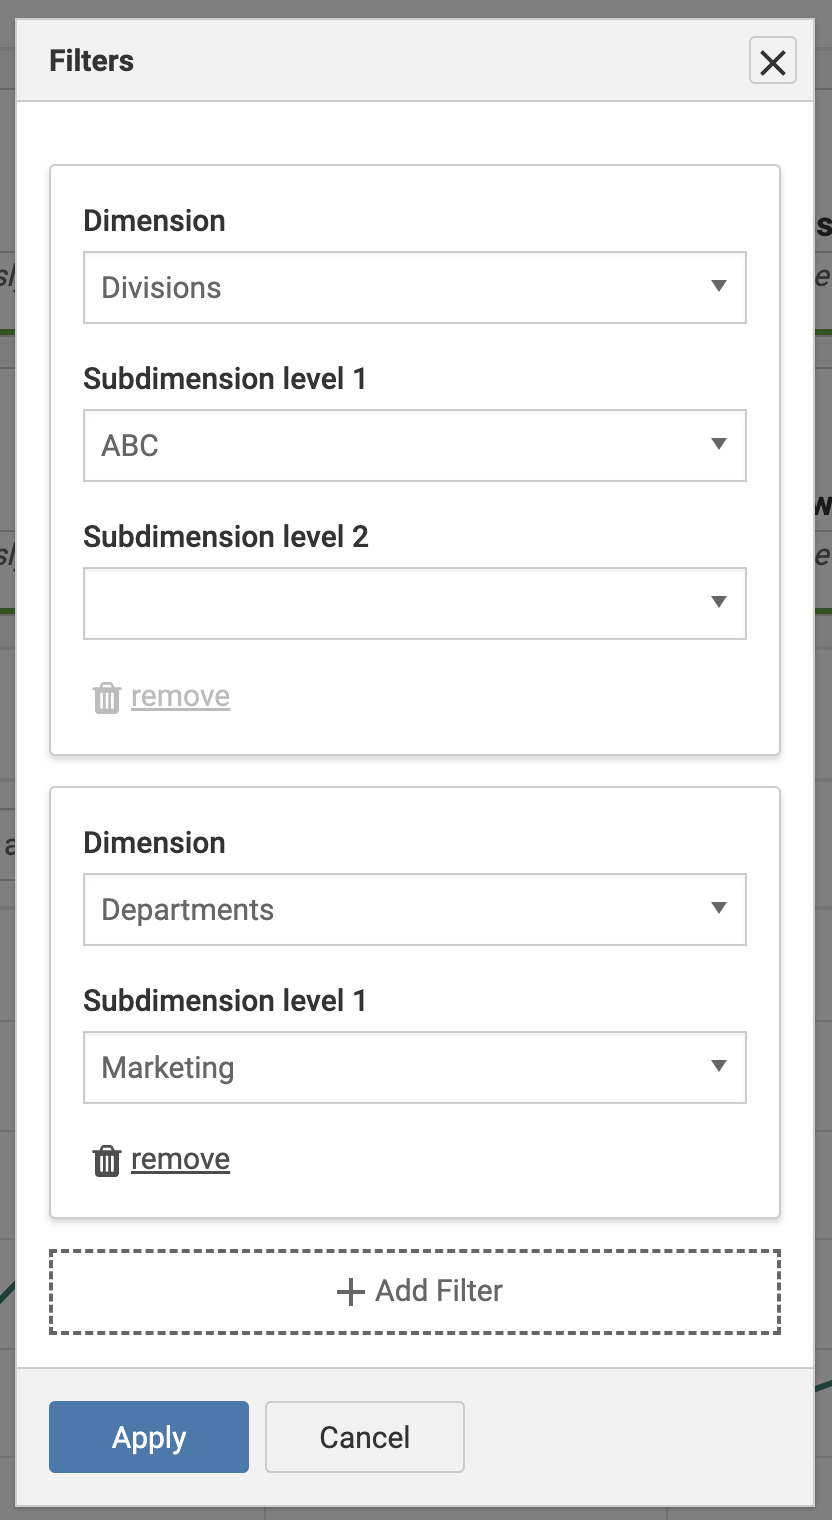
Filter to Narrow in on Improvements Across Dimensions
You may notice that your “Marketing” Department has declining accessibility scores on the websites they manage. To understand more specifics on where those scores are coming from, use the Filter button for any Outcome Report. Filter to the Department Dimension, then “Marketing”. Add a Dimension, such as Division. This will show the cross-section of data available if you’ve added Scans to both Dimensions. This will show you which Divisions your Marketing team should focus on improving accessibility first.
Bug Fixes - 2.0.4
- Users are now able to use CLI to create and assign dimensions
- added additional logging
Bug Fixes - 2.0.3
- Axe Reports users can now import axe DevTools JSON files in the axe Universal JSON format.
- In the Assign Projects/Scripts to Dimensions step of the Create/Edit Dimensions screen, the Select/Deselect All checkbox now applies to all items within the current search results.
Bug Fixes - 2.0.2
- The Dimensions Filter now accurately populates subdimensions when navigating from axe Monitor.
- A single Dimension can now contain data from axe Monitor, axe Reports, and axe DevTools for Web.
- In Step 3 of the Edit Dimension screen, all available Projects are now displayed when assigning Projects.
Known Issues - 2.0.2
- Dimensions with more than 1,000 subdimensions will not display data on Outcome Reports.
Bug Fixes - 2.0.1
-
Non-admin users can now switch Dimensions and apply filters when viewing Outcome Reports.
-
Loading times were improved for large datasets.
-
Errors that were caused by creating subdimensions have been fixed.
Known Issues - 2.0.1
-
After logging into Axe Reports, the Dimensions Filter sometimes does not properly load Subdimensions, and the + Add Filter button is unresponsive. Refresh your browser to use the filter.
-
Axe Reports does not currently allow users to assign axe Monitor Projects, axe Auditor Test Cases, or axe DevTools Scripts to a single Dimension. If a user tries to add an axe Monitor Project to a Dimension that already has an axe Auditor Test Case assigned, the associated scans from axe Auditor are deleted.
Recommendation: Avoid assigning multiple types of assets (for example, Projects and Test Cases) to the same Dimension until this issue is resolved.
-
When there are more than 66 Projects to display on the "Issues by Category" chart in the Accessibility Health Chart section, users encounter a blank page.
Browser/Driver Support
- Axe Reports has been tested and is supported on the latest versions of Chrome, Firefox, Safari, and Edge.