
Getting Started with axe Reports®
This topic introduces the first steps for setting up axe Reports. For more in-depth information about specific features, refer to the relevant sections in the user guide.
Step 1: Configure the Dashboard
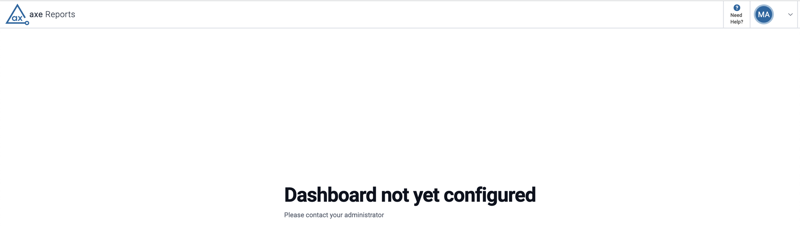
As an axe Reports Administrator, the system may prompt you to configure your dashboard when you log in for the first time. If this setup is not completed, your Project users will see a message instructing them to contact their axe Reports administrator when they attempt to log in.
Note for axe Monitor® Users: To ensure successful data import, ensure that axe Monitor is configured to send Scan information to axe Reports.
Step 2: Create Dimensions and Subdimensions
Axe Reports Administrators can create and manage Dimensions and subdimensions as part of their organizational structure. To add a new Dimension, go to the Dimensions page and click the + New Dimension button. To edit an existing Dimension, use the Edit Dimension icon button.
Step 3: Configure Test Cases, Scripts, and Projects
You can configure your Projects, Test Cases, or Scripts in axe Reports using different tools depending on your needs:
- axe Monitor: Use this tool to manage Projects. You can edit, delete, or move Projects between organizations. Refer to the "Manage the Project" section for more details. - Manage the Project
- axe Auditor (Test Cases): Manage Test Cases by editing or deleting them in the Manage Test Cases section. Manage Test Cases
- axe DevTools for Web: Import accessibility data through Scripts, which are groups of related pages scanned using spec files (for CLI) or automated tests (for API). - Configure the Script
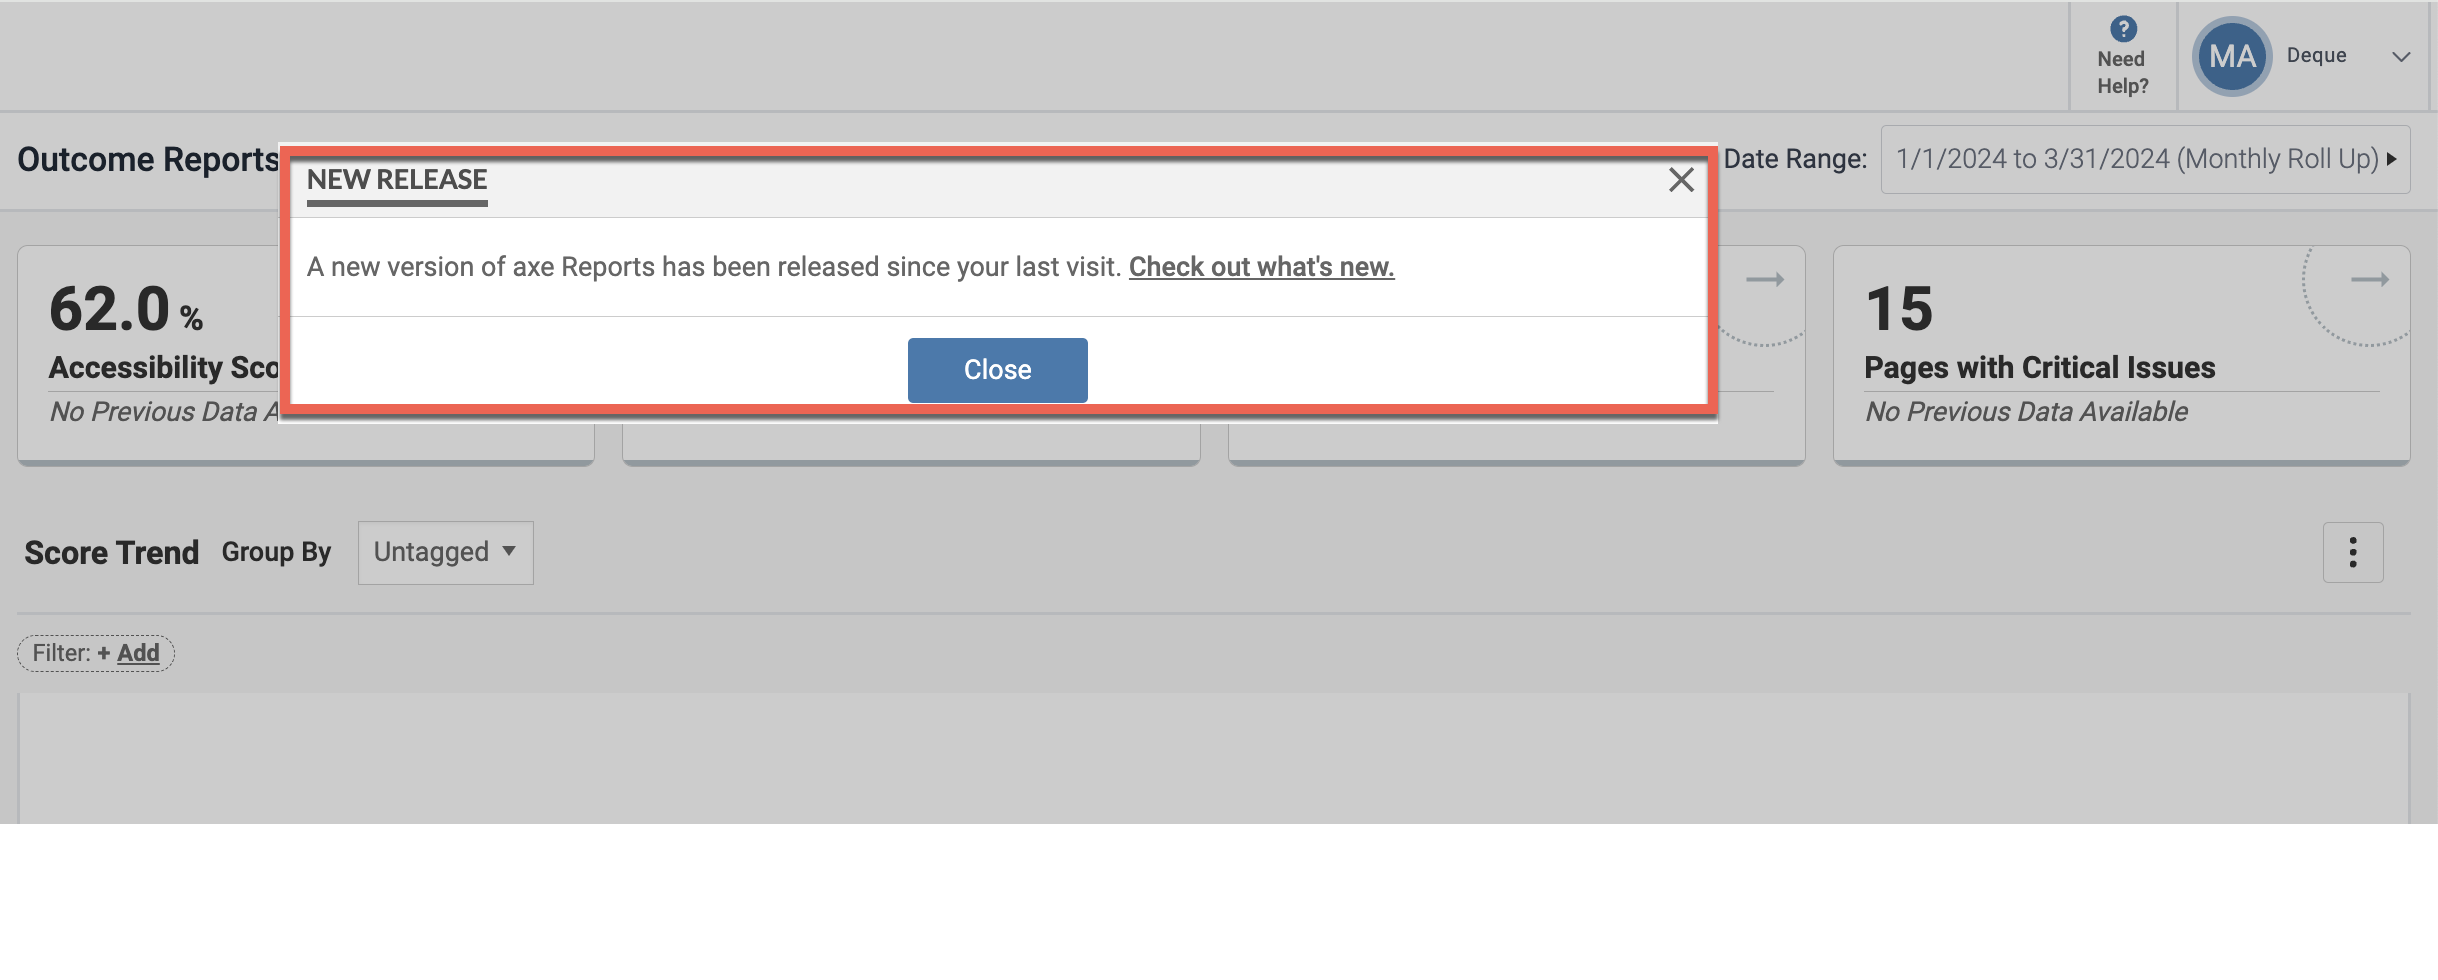
Note: Upon logging in after a new release, you will see a banner stating: "A new version of axe Reports has been released since your last visit. Check out what's new." This banner includes a link to the release notes.
Step 3: Use the Charts in axe Reports
After configuring your Projects, Test Cases, or Scripts, you can analyze your data using three types of charts in axe Reports:
-
Score Trend: Displays a time-series view of the accessibility scores across the selected hierarchy level. Score Trend
-
Accessibility Health: Provides an overview of accessibility issues by severity at the selected hierarchy level. Accessibility Health
-
Issues by Period: Shows how the total number of accessibility issues has changed over time, grouped by your chosen period (for example, by month). Issues By Period
Use axe DevTools Usage Reports
After configuring your Scripts, you can access Usage Reports, which track usage trends for various axe products. These reports provide insights into how the tools are being used across your organization and help managers make informed decisions to improve accessibility.
Note: Axe DevTools for Mobile users currently only have access to the "Usage by Month" report.
The available reports include:
- Scanned URL: Tracks the URLs scanned during accessibility checks.Scanned URL
- Usage by Month: Displays usage trends by month for the selected tools.Usage by Month