Highlight Violations
The axe Expert extension is officially retired. Read more about this on the axe Expert Replacement page. These pages will be taken down in July of 2024. Email helpdesk@deque.com with any questions or concerns.
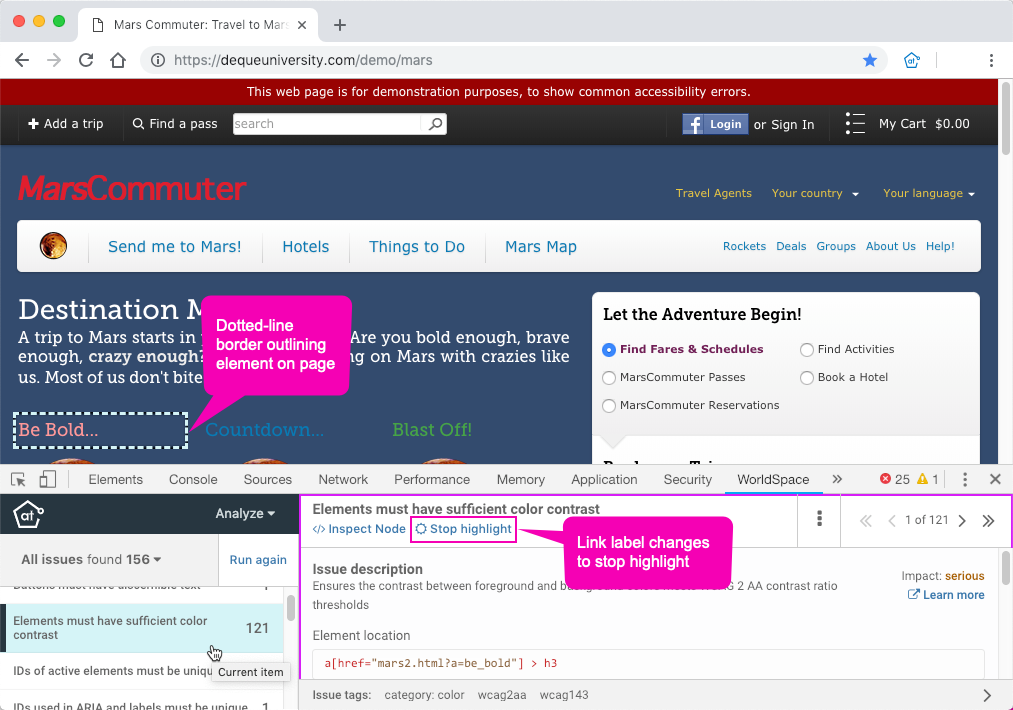
Follow this procedure when you want to highlight an element on the loaded web page from a violation in the axe Expert Analyze tool to visually inspect the area of the rendered page that contains the violating element.
Automatic highlighting notes
Once enabled, highlighting stays on until stopped manually. Immediately after analyzing a page, clicking a rule in the rule violation results list pane automatically displays the first violation in the right pane, and when highlighting has previously been enabled via the Highlight link, the target element containing the first violation highlights based on the currently selected rule violated in the analyzed page above the developer tools. Subsequently navigating to another violation will automatically highlight its element until you select Stop highlight (which the Highlight link changes to after being clicked). However, when you navigate to another developer tool or highlight something else on the SimulAT panel after analyzing a page, then go back to the Analyze panel again, that it becomes necessary to use the Highlight link again.
-
Select a
rulerow in the left results pane of the Analyze tab.
Tip: View the target and source code of the element related to the currently displayed violation viewing the Target, HTML and any Node information that is immediately displays in the content pane to the right, so you will have the information for reference purposes to compare with the highlighted element.
-
Activate
Highlightnear the top of the right content pane.

The Highlight link is a switch to turn highlighting on and off. You'll notice the link text changes to Stop highlight. Dotted lines outline the element on the loaded, analyzed page, and a dotted line outlines the element in which the rule violation was found on the rendered page above the axe Expert Extension user interface in the browser.

Select > to display another violation of the same rule. The Element source related to the currently shown violation also automatically highlights. Similarly, selecting a different rule row in the rule violation results list will cause its first violation target element to be highlighted. Select Stop highlight to toggle highlighting off.
