
Troubleshooting
Common problems and solutions with Axe Watcher
Watcher Only Supports Chrome for Testing, Chromium, or Microsoft Edge
Although the Axe Developer Hub website supports several browsers, the Watcher package only supports Google Chrome for Testing, Chromium, or Microsoft Edge. Problems you might encounter:
- If you use Google Chrome version 139 or later, you will receive an error from Watcher. Use Chrome for Testing, Chromium, or Microsoft Edge instead.
- If you use Cypress's Electron browser, you will receive an error. Specify the browser as Chrome for Testing, Chromium, or Microsoft Edge when you invoke Cypress; otherwise, it will default to the Electron browser. See Launching Browsers in the Cypress documentation for more information.
If you use WebdriverIO, WebDriverJS, or Java Selenium, you must configure your test setup to use Chrome for Testing or Microsoft Edge explicitly. See Use Chrome for Testing for installation steps and platform-specific configuration examples.
See Automated Testing Platforms for more information about supported software with Watcher.
Microsoft Edge Fails with Java Selenium
If your Java Selenium tests throw an IllegalStateException with the message Microsoft Edge support requires Selenium 4 or newer, your project is using Selenium 3. Selenium 3's EdgeOptions targets the legacy EdgeHTML browser, which Axe Watcher doesn't support. Upgrade selenium-java to 4.x to test in Microsoft Edge, or keep testing in Chrome for Testing or Chromium with ChromeOptions and ChromeDriver, which the Java Selenium integration supports on Selenium 3.141.59 and later.
No Results from Microsoft Edge with WebdriverIO
If your WebdriverIO tests run against Microsoft Edge, complete without any error, and produce no results in Axe Developer Hub, check your Watcher version. Using Microsoft Edge with WebdriverIO requires Watcher 4.6.0 or later.
On earlier versions, Watcher sent its browser options to the goog:chromeOptions capability. The Microsoft Edge WebDriver reads them from ms:edgeOptions instead, so the options were ignored and no analysis ran. Nothing failed, which is why the tests passed with an empty result set. Upgrade to 4.6.0 or later to resolve the problem.
The args Property of a Browser Capability Is Invalid
If Watcher reports that the args property of your goog:chromeOptions or ms:edgeOptions browser capability must be an array of strings, set args to an array of browser command-line flags, or remove it:
capabilities: {
  browserName: 'MicrosoftEdge',
  'ms:edgeOptions': {
    args: ['--window-size=1280,720']
  }
}
Values such as a single string, an object, or an array containing something other than a string are rejected. Watcher 4.5.0 and earlier accepted some of these and failed later with an unrelated error.
Accessibility Issues Inside a Cross-Origin Iframe Are Missing
If your analysis succeeds but your results contain nothing from an <iframe> served from a different origin than the page under test, that frame wasn't analyzed. Watcher always analyzes same-origin frames, but it analyzes a cross-origin frame only when you list that frame's origin:
- (JavaScript or TypeScript)
allowedOrigins - (Java)
setAllowedOrigins()
axe: {
  allowedOrigins: [ 'https://pay.example.com' ]
}
Don't include your own application's origin, which is always allowed.
To confirm which origins were skipped, look for the cross_origin_frame_not_allowlisted diagnostic. It's reported whether or not you've set the option, it names the cross-origin origins that weren't analyzed, and it prints the configuration line you can paste in. Diagnostics appear only in debug output: set DEBUG=axe-watcher:* when you run your tests (JavaScript or TypeScript), or configure your logging framework to show DEBUG messages for Axe Watcher (Java). With the Java Selenium integration, you can also turn on debug logging with enableDebugLogger().
If results are still missing after you list the origin:
- The frame has a
sandboxattribute that omitsallow-same-origin, reported ascross_origin_frame_unscannable. The frame then has an opaque origin that no entry in your list can name. Addallow-same-originto thesandboxattribute. - The frame redirects away from the origin in its
src, such as an apex domain redirecting towww, orhttpredirecting tohttps. List the origin the frame actually ends up on. - The frame is nested more than one level deep. Coverage diagnostics are reported from the top-level page about the frames it embeds directly, so a deeply nested frame goes unreported.
If the analysis fails outright rather than under-reporting, look for the cross_origin_frame_timed_out diagnostic: a frame answered Watcher's initial ping but didn't return results in time. Either remove that origin from your list or raise runOptions.frameWaitTime.
If the frame is analyzed but its results don't reflect what your test did inside it, automatic analysis is the cause. It can't detect changes made inside a frame, so an allowed frame is analyzed as of the last change to the top-level page. Call analyze() yourself after interacting with content inside a frame. This is a separate problem from No Page States Captured After Switching to a Child Frame, which applies when the browser's context is switched into the frame.
See Analyze Cross-Origin iframes for the full picture.
Origins Rejected by allowedOrigins
If Watcher reports that an allowedOrigins entry is invalid, the entry isn't a plain origin it can compare against a frame. Each entry needs a scheme (http or https), a host, and an optional port, with nothing else. Common causes:
- A wildcard, such as
https://*.example.com. Name every origin explicitly. - A path, query string, fragment, or credentials, such as
https://pay.example.com/checkout. - A missing scheme, such as
pay.example.com. - A scheme other than
httporhttps. - A domain containing characters outside the English alphabet, such as
café.example.com. Use the punycode form instead.
Watcher rejects these rather than ignoring them, because an entry that doesn't match a frame's real origin would leave the frame unanalyzed while your test run still reported success. See Analyze Cross-Origin iframes.
Incomplete Results
If your test suite uses multiple test runners that run in parallel and use the same non-null build ID, each test runner's results will replace those of other test runners for the same Git commit SHA, giving incomplete results. You must ensure that each test runner uses the same non-null build ID.
You typically set the build ID in your AxeConfiguration.
For more information about using parallel test runners with different CI/CD platforms, see Running Tests in Parallel.
Duplicate Accessibility Errors or New Issues Count Wrong
If your website uses dynamic IDs that change whenever the page is refreshed, you will likely see duplicate accessibility errors, particularly issues marked as new when previous test runs exhibit the same issue on the same element. (Axe Developer Hub identifies the same element between test runs by its CSS selector and its XPath, both of which incorporate the element's ID.) To solve this problem, you must set the ancestry property in the runOptions object in your configuration to true. The example below shows how to set the option in your configuration:
axe: {
  runOptions: {
    ancestry: true
  }
}
See Using Dynamic Selectors for more guidance on using dynamic selectors.
If your issue counts are still wrong after enabling ancestry, check whether the URLs your tests visit change between runs. The URL is compared in full, including any query string, so a session ID or cache-busting parameter makes every issue on the page look new. See Dynamic URLs.
See (JavaScript/TypeScript) runOptions or (Java) AxeWatcherOptions.setRunOptions() for more information.
Old Version of @axe-core/watcher
If you're using version 3.18.0 or older of @axe-core/watcher, you will receive this warning message:
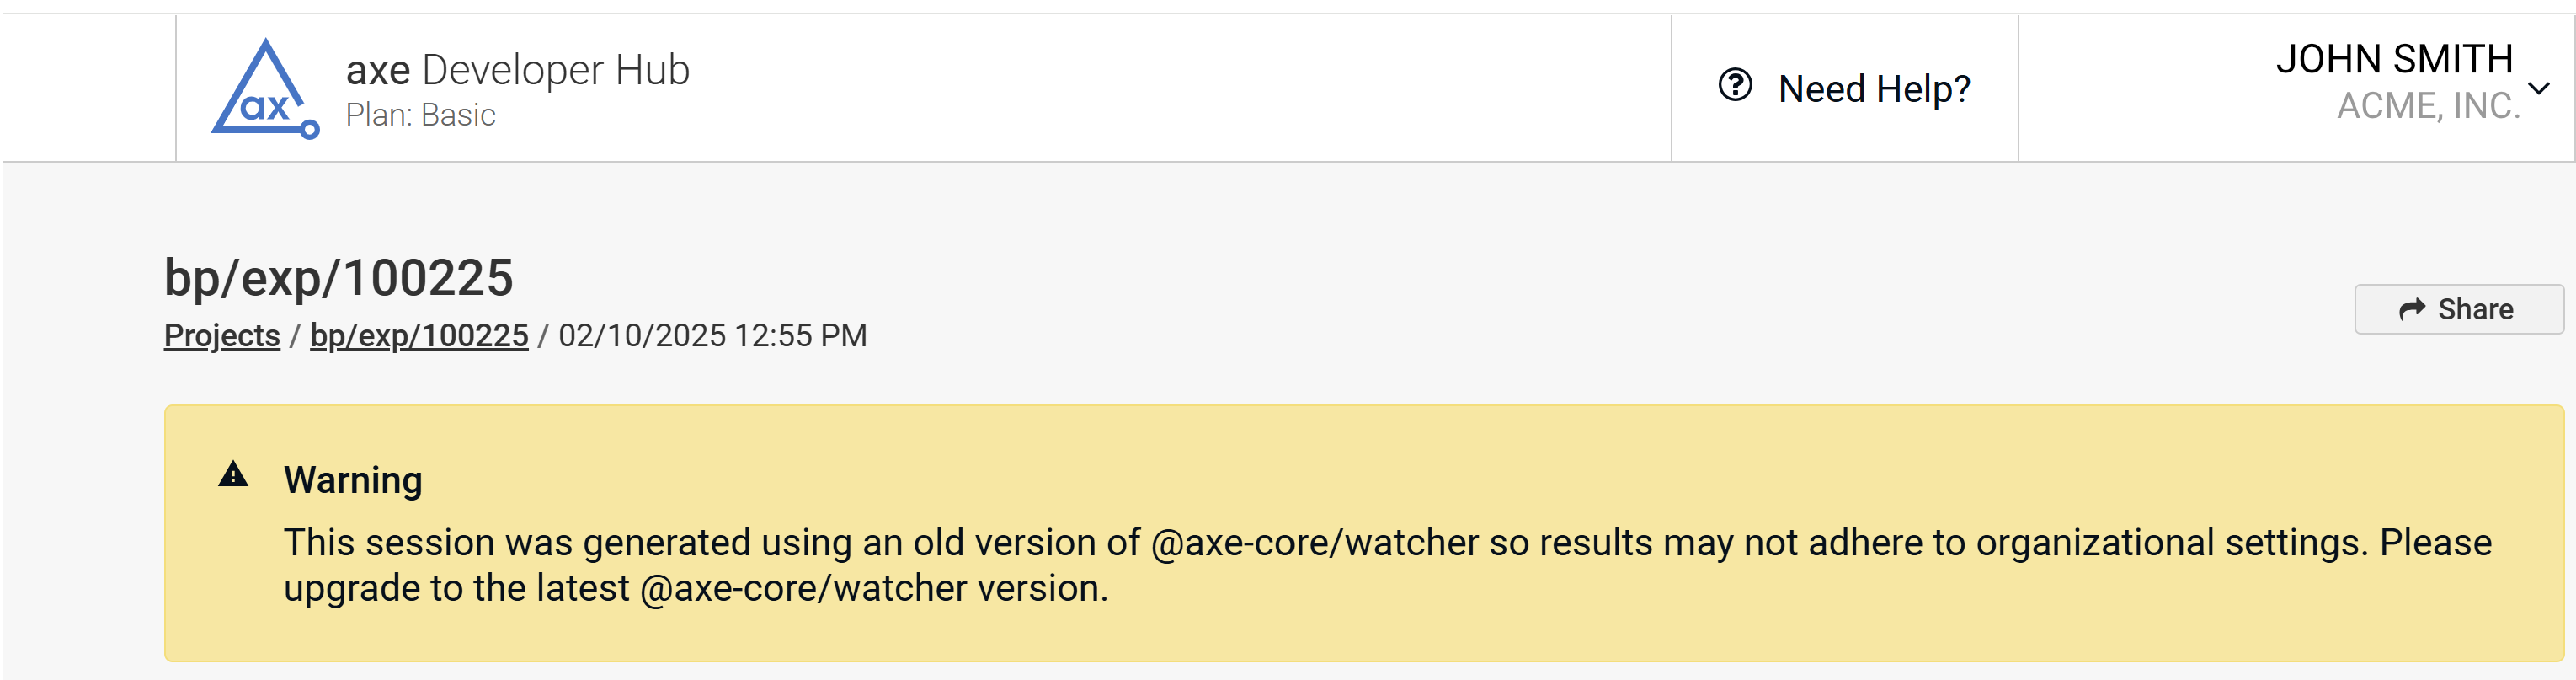
Axe Developer Hub now adheres to the settings defined in Axe Configuration, and test runs created by versions of @axe-core/watcher version 3.18.0 or older generate sessions that were unaware of the global settings in Axe Configuration. You should update your @axe-core/watcher package and rerun your tests to create sessions that follow your enterprise's Axe Configuration. See Using Global Configurations.
No Page States Captured After Switching to a Child Frame
If your test switches the browser's current context to a child frame using switchToFrame() (WebdriverIO or WebDriverJS) or switchTo().frame() (Java Selenium), Axe Watcher will not capture page states for any actions taken while the browser is focused on the child frame. Axe Watcher captures page states only while the browser's context is on the top-level frame.
This is a separate matter from whether iframe content is analyzed. Watcher analyzes same-origin frames, and cross-origin frames whose origin you list; see Analyze Cross-Origin iframes.
For example, in WebdriverIO, the click() call below will not produce a page state:
await browser.url('https://example.com')
const iframe = await browser.$('iframe')
await browser.switchToFrame(iframe)
// Actions taken in the child frame will not be analyzed
await button.click()
To resume capturing page states, switch back to the top-level frame before continuing:
// WebdriverIO
await browser.switchToParentFrame()

// WebDriverJS / Java Selenium
await driver.switchTo().defaultContent()Cypress is not affected by this limitation.
Playwright's and Puppeteer's setContent() Methods Are Not Supported
Axe Watcher does not support tests that call Playwright's page.setContent() or frame.setContent() methods, or Puppeteer's page.setContent() or frame.setContent() methods. The Playwright limitation applies to both the JavaScript/TypeScript package and the Java library. The Puppeteer limitation applies only to the JavaScript/TypeScript package, which is the only Axe Watcher integration that supports Puppeteer.
These methods replace the entire document, using document.write() internally, which discards the context Axe Watcher relies on to analyze the page. Axe Watcher analyzes the page successfully up to the point of the call, but after it, Axe Watcher can no longer analyze the page or send its results, and your test fails with timeout messages similar to the following:
Error: Watcher timed out before it could finish analyzing the page state. To resolve this problem, increase the `timeout.analyze` property within your configuration or see https://docs.deque.com/developer-hub/2/en/dh-troubleshooting for more troubleshooting.

Error: Watcher timed out sending results to the server. To resolve this problem, increase the `timeout.flush` property within your configuration or see https://docs.deque.com/developer-hub/2/en/dh-troubleshooting for more troubleshooting.Despite what these messages suggest, increasing the timeout.analyze and timeout.flush values does not resolve this problem. See Set Timeouts for the cases where adjusting timeouts does help.
Instead of setting the markup directly, serve it from a URL and navigate to it with page.goto() so that the browser loads the document normally:
// Not supported by Axe Watcher:
await page.setContent('<my-button disabled></my-button>')

// Navigate to a URL that serves the same markup instead:
await page.goto('http://localhost:6006/my-button.html')
Cypress Fails with allowCypressEnv Set to false
If your Cypress tests fail before any test runs with an error similar to the following, your project sets allowCypressEnv: false and uses Watcher 4.6.0 or earlier:
CypressError: `Cypress.env()` does not work when `allowCypressEnv` is set to `false`.
The variable being accessed was: `__AXE_WATCHER_AUTO_ANALYZE`
Earlier versions of Watcher read their configuration with Cypress.env(), which Cypress blocks when allowCypressEnv is false and removes in Cypress 16. Upgrade to Watcher 4.7.0 or later, which reads its configuration with Cypress.expose() instead. No other configuration changes are needed.
Extra Page State Generated by cy.screenshot()
If you call cy.screenshot() in your Cypress tests, Axe Watcher may generate an extra page state. When Cypress takes a screenshot, it briefly modifies the DOM to disable animations, and Axe Watcher's DOM observer can detect that modification as a page-state change. This is expected behavior and does not affect the accuracy of your accessibility results.
Controller Method Timing Out
Java Watcher does not currently allow you to change timeout values.
(JavaScript or TypeScript only) You will receive a message similar to the following if calls to the Controller methods (defined in the Controller abstract base class as analyze(), flush(), start(), and stop()) or Cypress custom commands time out:
Error: Watcher could not send results to the server. To resolve this problem, adjust your `timeout.flush` property within your configuration or see https://docs.deque.com/developer-hub/wa-troubleshooting for more troubleshooting.The specified Controller method (here, the flush() method) required more than the default time to complete and timed out. You can change the default time by adding a timeout object to your configuration:
axe: {
  timeout: {
    flush: 10000
  }
}These timeout values are independent of the test framework you're using, and you might also need to increase the timeout values for that framework.
See Set Timeouts for information on using timeouts.
See Timeouts Interface and timeouts for more information. The default timeout values are shown in the table under the Timeouts Interface.
Results Not Appearing
If you've run your test suite and no results are showing up in Axe Developer Hub for a certain project, the cause could be found among the reasons in the following sections:
Not Configuring Axe Watcher
Your modified test suite must call the appropriate configuration function for your test framework before running your tests. If you don't configure Axe Watcher properly, you will receive a message that you need to configure Axe Watcher. For example, if you forget to configure Axe Watcher with Cypress, you will see this message when you run your test suite:
Cypress is not configured for axe Watcher. Please ensure that axe Watcher's cypressConfig() is invoked within Cypress's defineConfig() in your cypress.config.js. All tests will fail with this error.Consult the configuration instructions for configuration examples for your language and browser test framework.
Not Flushing Results
You need to call the flush() function (or the custom command axeWatcherFlush() in Cypress) to send the collected results back to Deque's servers so the results can be presented on the Axe Developer Hub website. Usually, you call the flush() function in your automation platform's cleanup hook.
For example, in the support/e2e.js file in Cypress you add the call to afterEach():
// Flush axe-watcher results after each test.
afterEach(() => {
  cy.axeWatcherFlush()
})
Using the --incognito Option
You cannot use the --incognito command-line option with Chrome; otherwise, your tests will silently fail. If you're using incognito mode to avoid writing cached files to disk (cached files are kept in memory only in incognito mode), use your testing suite's caching methods instead.
Not Setting the Required Environment Variables
If you're experimenting with the samples in the watcher-examples repo on GitHub, note that the samples use environment variables for setting the API key and project ID, API_KEY and PROJECT_ID.
Test Running Too Quickly
Your tests might run too quickly, unloading the page and freeing up its resources before Watcher can analyze it. To fix this problem, you can add a delay at the end of the test to allow time to analyze the page.
For example, in Cypress, you can add a delay of 10 seconds (10,000 milliseconds) with the cy.wait() method:
describe('Visitor', () => {
  it('should visit example.com', () => {
    cy.visit('https://www.example.com')
    cy.wait(10000);  })
})
Run Rejected: Data Shape or Repository Doesn't Match the Project
Once a project has ingested its first successful session, its data shape (Git or Gitless) and, for Git projects, its repository, are locked. A run that doesn't match the lock is rejected at ingestion, and the results are not saved. The rejection message names what the project expects, what the run sent, and what to do about it, for example:
This project is locked to a different repository. Project expects {lockedRepo}; this run sent {incomingRepo}. The results were not ingested. Send this run to its own Axe Developer Hub project, or check that CI is providing git information for the locked repository.Common causes and how to resolve them:
- A second repository or test suite is pointed at the same project. Send it to its own project instead of the one already locked to a different repository.
- A shallow clone, detached HEAD state, or a missing
originremote is stripping the repository URL, branch, or commit SHA, making a Git run look Gitless. See Axe Watcher in Continuous Integration (CI) Environments for CI-specific guidance. - Git data collection was disabled on a project already locked to Git. Sending a run with
git: falseno longer converts the project to Gitless; the run is rejected. Send Gitless runs to a separate, Gitless-locked project instead.
Missing or Invalid API Key
An invalid or missing API key appears as an invalid configuration file in Cypress. The stack trace will reveal whether it is invalid or missing. A missing key results in the following:
AssertionError [ERR_ASSERTION]: API key is required
    at validateApiKey ...
(Many lines of the stack trace were deleted for brevity.)
An invalid key results in the following stack trace (shortened):
Error: Server responded to https://axe.deque.com/api/api-keys/test/validate/axe-devtools-watcher with status code 404:
{"error":"Invalid API key"}
    at Response.getBody
...
Help
If you can't resolve your problem, please email us so we can help.